by Calculated Risk on 8/04/2023 08:16:00 PM
Friday, August 04, 2023
Aug 4th COVID Update: New Pandemic Low for Deaths

| COVID Metrics | ||||
|---|---|---|---|---|
| Now | Week Ago | Goal | ||
| Hospitalized2🚩 | 6,121 | 5,686 | ≤3,0001 | |
| Deaths per Week2 | 426 | 437 | ≤3501 | |
| 1my goals to stop weekly posts, 2Weekly for Currently Hospitalized, and Deaths 🚩 Increasing number weekly for Hospitalized and Deaths ✅ Goal met. | ||||
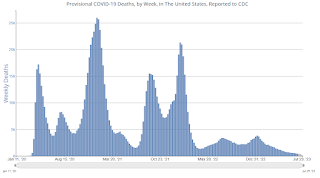 Click on graph for larger image.
This graph shows the weekly (columns) number of deaths reported.
The impact of 7% Mortgage Rates
by Calculated Risk on 8/04/2023 01:48:00 PM
Today, in the Calculated Risk Real Estate Newsletter: The impact of 7% Mortgage Rates
A brief excerpt:
The following table is from the Freddie Mac’s primary mortgage market survey (PMMS)..There is much more in the article. You can subscribe at https://calculatedrisk.substack.com/
Existing home sales bottomed in December 2022 and January 2023 on a seasonally adjusted annual rate (SAAR) basis. Those closed sales were for contracts signed mostly in the October through December timeframe when rates were the highest.
The recent surge in rates started in June, and if there is an impact on sales from higher mortgage rates, it will likely impact closed sales in the August through October timeframe. We will know about July sales very soon as local market data is released.
There will likely be less of an impact on new home sales since homebuilders will offer various incentives and mortgage rate buydowns (3-2-1 is fairly common - with the homebuilder buying the rate down by 3 percentage points in year 1, 2 percentage points in year 2, and 1 percentage point in year 3).
AAR: July Rail Carloads and Intermodal Decreased Year-over-year
by Calculated Risk on 8/04/2023 01:05:00 PM
From the Association of American Railroads (AAR) Rail Time Indicators. Graphs and excerpts reprinted with permission.
The July 4th holiday complicates an analysis of U.S. rail volumes in July, but there were some encouraging signs.
For example, the three non-July 4 weeks in July were the three highest-volume intermodal weeks of the year for U.S. railroads. Intermodal in July 2023 was still down 5.5% from July 2022, but that’s the smallest percentage decline for any month so far this year.
emphasis added
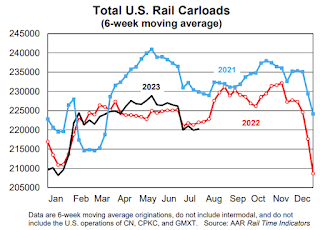 Click on graph for larger image.
This graph from the Rail Time Indicators report shows the six-week average of U.S. Carloads in 2021, 2022 and 2022:
U.S. railroads originated 875,660 total carloads in July 2023, down 0.6% from July 2022 and their second straight small decline. Carloads averaged 218,915 per week in July 2023, the fewest for any month so far in 2023. July 4th is a big reason for that — the week of July 4th is always one of the lowest-volume weeks of the year. .
 The second graph shows the six-week average (not monthly) of U.S. intermodal in 2021, 2022 and 2023: (using intermodal or shipping containers):
U.S. intermodal volume averaged 241,888 containers and trailers per week in July 2023, down 5.5% from July 2022 and the 23rd decline in the past 24 months. July’s percentage decline was the smallest so far this year. The three non-July 4 weeks in July were the three highest-volume intermodal weeks of the year, which could be a hopeful sign for the future.
Comments on July Employment Report
by Calculated Risk on 8/04/2023 09:20:00 AM
The headline jobs number in the July employment report was slightly below expectations, however, employment for the previous two months was revised down by 49,000, combined. The participation rate was unchanged, and the employment population ratio increased slightly, and the unemployment rate decreased to 3.5%.
In July, the year-over-year employment change was 3.36 million jobs.
Prime (25 to 54 Years Old) Participation
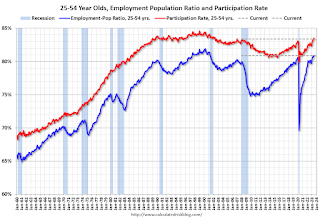 Since the overall participation rate is impacted by both cyclical (recession) and demographic (aging population, younger people staying in school) reasons, here is the employment-population ratio for the key working age group: 25 to 54 years old.
The 25 to 54 participation rate decreased in July to 83.4% from 83.5% in June, and the 25 to 54 employment population ratio was unchanged at 80.9% from 80.9% the previous month.
Average Hourly Wages
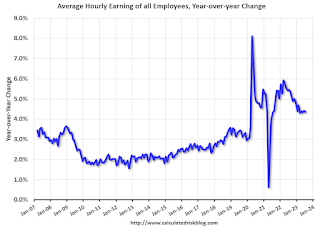 The graph shows the nominal year-over-year change in "Average Hourly Earnings" for all private employees from the Current Employment Statistics (CES).
 Wage growth has trended down after peaking at 5.9% YoY in March 2022 and was at 4.4% YoY in July.
Part Time for Economic Reasons
 From the BLS report:
"The number of persons employed part time for economic reasons, at 4.0 million, changed little in July. These individuals, who would have preferred full-time employment, were working part time because their hours had been reduced or they were unable to find full-time jobs."The number of persons working part time for economic reasons decreased in July to 4.00 million from 4.19 million in June. This is below pre-recession levels.
These workers are included in the alternate measure of labor underutilization (U-6) that decreased to 6.7% from 6.9% in the previous month. This is down from the record high in April 22.9% and up from the lowest level on record (seasonally adjusted) in December 2022 (6.5%). (This series started in 1994). This measure is below the 7.0% level in February 2020 (pre-pandemic).
Unemployed over 26 Weeks
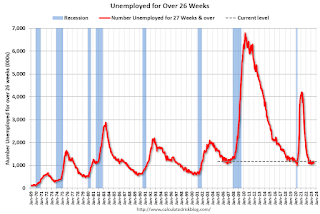 This graph shows the number of workers unemployed for 27 weeks or more.
 According to the BLS, there are 1.164 million workers who have been unemployed for more than 26 weeks and still want a job, down from 1.105 million the previous month.
This is at pre-pandemic levels.
Summary:
The headline monthly jobs number was slightly below consensus expectations; however, May and June payrolls were revised down by 49,000 combined.
July Employment Report: 187 thousand Jobs, 3.5% Unemployment Rate
by Calculated Risk on 8/04/2023 08:42:00 AM
From the BLS:
Total nonfarm payroll employment rose by 187,000 in July,, and the unemployment rate changed little at 3.5 percent, the U.S. Bureau of Labor Statistics reported today. Job gains occurred in health care, social assistance, financial activities, and wholesale trade.
...
The change in total nonfarm payroll employment for May was revised down by 25,000, from +306,000 to +281,000, and the change for June was revised down by 24,000, from +209,000 to +185,000. With these revisions, employment in May and June combined is 49,000 lower than previously reported.
emphasis added
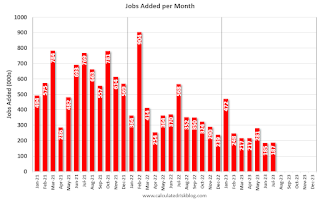 Click on graph for larger image.
The first graph shows the jobs added per month since January 2021.
Payrolls for May and June were revised down 49 thousand, combined.
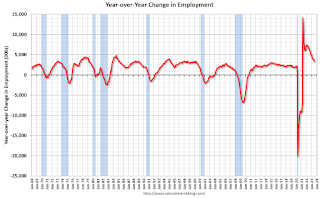 The second graph shows the year-over-year change in total non-farm employment since 1968.
In July, the year-over-year change was 3.36 million jobs. Employment was up significantly year-over-year but has slowed to more normal levels of job growth recently.
The third graph shows the employment population ratio and the participation rate.
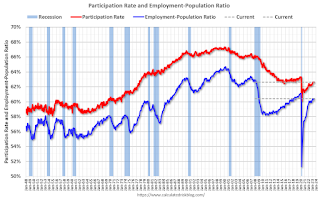 The Labor Force Participation Rate was unchanged at 62.6% in July, from 62.6% in June. This is the percentage of the working age population in the labor force.
 The Employment-Population ratio increased to 60.4% from 60.3% (blue line).
I'll post the 25 to 54 age group employment-population ratio graph later.
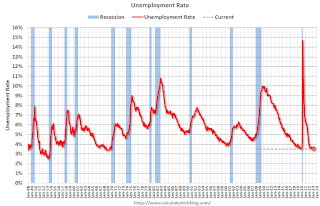 The fourth graph shows the unemployment rate.
 The unemployment rate decreased in July to 3.5% from 3.6% in June.
This was slightly below consensus expectations; however, May and June payrolls were revised down by 49,000 combined.
Thursday, August 03, 2023
Friday: Employment Report
by Calculated Risk on 8/03/2023 08:54:00 PM
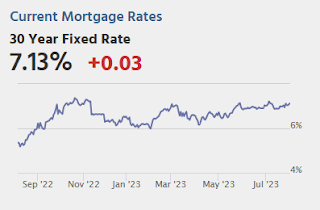
Friday:
• At 8:30 AM ET, Employment Report for July. The consensus is for 184,000 jobs added, and for the unemployment rate to be unchanged at 3.6%.
Realtor.com Reports Weekly Active Inventory Down 9% YoY; New Listings Down 17% YoY
by Calculated Risk on 8/03/2023 04:11:00 PM
Realtor.com has monthly and weekly data on the existing home market. Here is their weekly report from Danielle Hale: Weekly Housing Trends View — Data Week Ending July 29, 2023
• Active inventory declined, with for-sale homes lagging behind year ago levels by 9%. This week marks a 6th consecutive decline in the number of homes actively for sale compared to the prior year, and the gap is growing.
• New listings–a measure of sellers putting homes up for sale–were down again this week, by 17% from one year ago. For 56 weeks, there have been fewer newly listed homes compared to the same time one year ago. Last week we noted that while the gap from a percent change has been fairly consistent this year, it could wane in the weeks ahead as the second half of 2022 new listing were particularly low.
 Here is a graph of the year-over-year change in inventory according to realtor.com.
 Inventory was down 8.6% year-over-year - this was the sixth consecutive week with a YoY decrease following 58 consecutive weeks with a YoY increase in inventory.
Hotels: Occupancy Rate Up 0.6% Year-over-year
by Calculated Risk on 8/03/2023 02:40:00 PM
U.S. hotel performance declined slightly from the previous week but showed improved comparisons year over year, according to CoStar’s latest data through 29 July. ...The following graph shows the seasonal pattern for the hotel occupancy rate using the four-week average.
23-29 July 2023 (percentage change from comparable week in 2022):
• Occupancy: 72.2% (+0.6%)
• Average daily rate (ADR): US$161.83 (+2.3%)
• Revenue per available room (RevPAR): US$116.91 (+2.9%)
emphasis added
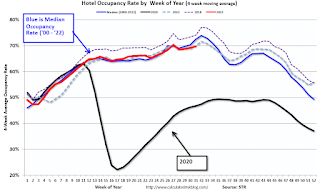 Click on graph for larger image.
The red line is for 2023, black is 2020, blue is the median, and dashed light blue is for 2022. Dashed purple is for 2018, the record year for hotel occupancy.
July Employment Preview
by Calculated Risk on 8/03/2023 01:01:00 PM
On Friday at 8:30 AM ET, the BLS will release the employment report for July. The consensus is for 184,000 jobs added, and for the unemployment rate to be unchanged at 3.6%.
From BofA economists:
"For the July employment report, we expect nonfarm payroll employment increased by 200k, little changed from the 209k gain in June. ... We expect the unemployment rate to hold at 3.6%."From Goldman Sachs following the strong ADP report:
"[The] ADP report was consistent with the strong pace of July hiring suggested by other alternative employment indicators. We left our nonfarm payroll forecast unchanged at an above-consensus +250k ahead of Friday’s release."• ADP Report: The ADP employment report showed 324,000 private sector jobs were added in July. This suggests job gains well above consensus expectations, however, in general, ADP hasn't been very useful in forecasting the BLS report.
• ISM Surveys: Note that the ISM services are diffusion indexes based on the number of firms hiring (not the number of hires). The ISM® manufacturing employment index decreased in July to 44.4%, down from 48.1% last month. This would suggest about 50,000 jobs lost in manufacturing. The ADP report indicated 36,000 manufacturing jobs lost in July.
The ISM® services employment index decreased in July to 50.7%, up from 53.1% last month. This would suggest about 90,000 jobs added in the service sector. Combined this suggests job gains of 40,000, well below consensus expectations.
• Unemployment Claims: The weekly claims report showed a sharp increase in the number of initial unemployment claims during the reference week (includes the 12th of the month) from 265,000 in June to 228,000 in July. This suggests more layoffs in July than in June.
ISM® Services Index Decreases to 52.7% in July
by Calculated Risk on 8/03/2023 10:00:00 AM
(Posted with permission). The ISM® Services index was at 52.7%, down from 53.9% last month. The employment index decreased to 50.7%, from 53.1%. Note: Above 50 indicates expansion, below 50 in contraction.
From the Institute for Supply Management: Services PMI® at 52.7% July 2023 Services ISM® Report On Business®
Economic activity in the services sector expanded in July for the seventh consecutive month as the Services PMI® registered 52.7 percent, say the nation's purchasing and supply executives in the latest Services ISM® Report On Business®. The sector has grown in 37 of the last 38 months, with the lone contraction in December of last year.The PMI was below expectations.
The report was issued today by Anthony Nieves, CPSM, C.P.M., A.P.P., CFPM, Chair of the Institute for Supply Management® (ISM®) Services Business Survey Committee: “In July, the Services PMI® registered 52.7 percent, 1.2 percentage points lower than June’s reading of 53.9 percent. The composite index indicated growth in July for the seventh consecutive month after a reading of 49.2 percent in December, which was the first contraction since June 2020 (45.4 percent). The Business Activity Index registered 57.1 percent, a 2.1-percentage point decrease compared to the reading of 59.2 percent in June. The New Orders Index expanded in July for the seventh consecutive month after contracting in December for the first time since May 2020; the figure of 55 percent is 0.5 percentage point lower than the June reading of 55.5 percent.
“The Supplier Deliveries Index registered 48.1 percent, 0.5 percentage point higher than the 47.6 percent recorded in June. In the last six months, the average reading of 47.6 percent (with a low of 45.8 percent in March) reflects the fastest supplier delivery performance since June 2009, when the index registered 46 percent. (Supplier Deliveries is the only ISM® Report On Business® index that is inversed; a reading of above 50 percent indicates slower deliveries, which is typical as the economy improves and customer demand increases.)
emphasis added


