 RSS Feed
 by Calculated Risk on 8/07/2023 10:07:00 AM
Monday, August 07, 2023
Wholesale Used Car Prices Decreased 1.6% in July; Down 11.6% Year-over-year
From Manheim Consulting today: Wholesale Used-Vehicle Prices See Large Decline in June
Wholesale used-vehicle prices (on a mix, mileage, and seasonally adjusted basis) decreased 1.6% in July from June. The Manheim Used Vehicle Value Index (MUVVI) declined to 211.7, down 11.6% from a year ago.
“The July drop of 1.6% is an indicator of slowing wholesale price declines, at least when compared to the month-over-month losses we’ve seen since April,” said Chris Frey, senior manager of Economic and Industry Insights for Cox Automotive. “While the year-over-year price drop was again double-digit, let’s put some perspective on that. From July 2020, there were 22 straight monthly double-digit increases through April 2022; we’ve had just six double-digit declines since October last year, with only four of them consecutive. Keeping to the April theme, we’re now back to the same index value last seen in April 2021: 211.7. Used retail inventory continues to rebuild; but with used retail sales also showing some summer strength, we do not foresee wholesale price declines of serious import through December.”
July’s decrease was softened by the seasonal adjustment. The non-adjusted price change in July decreased by 3.8% compared to June, moving the unadjusted average price down 10.7% year over year.
emphasis added
 Click on graph for larger image.
This index from Manheim Consulting is based on all completed sales transactions at Manheim’s U.S. auctions.
The Manheim index suggests used car prices decreased in June (seasonally adjusted) and were down 11.6% year-over-year (YoY).
Housing August 7th Weekly Update: Inventory increased 0.7% Week-over-week; Down 10.3% Year-over-year
by Calculated Risk on 8/07/2023 08:21:00 AM
Altos reports that active single-family inventory was up 0.7% week-over-week.
 Click on graph for larger image.
This inventory graph is courtesy of Altos Research.
As of August 4th, inventory was at 488 thousand (7-day average), compared to 485 thousand the prior week.
Year-to-date, inventory is down 0.6%. And inventory is up 20.3% from the seasonal bottom 16 weeks ago.

The red line is for 2023. The black line is for 2019. Note that inventory is up from the record low for the same week in 2021, but below last year and still well below normal levels.
Inventory was down 10.3% compared to the same week in 2022 (last week it was down 10.1%), and down 49.3% compared to the same week in 2019 (last week down 49.5%).
It appears same week inventory will be below 2022 levels for the remainder of the year. It is possible that inventory will fall below the record lows in 2021 and early 2022 later this year or in early 2024, but currently that seems unlikely.
Mike Simonsen discusses this data regularly on Youtube.
Sunday, August 06, 2023
Sunday Night Futures
by Calculated Risk on 8/06/2023 06:15:00 PM
Weekend:
• Schedule for Week of August 6, 2023
Monday:
• No major economic releases scheduled.
From CNBC: Pre-Market Data and Bloomberg futures S&P 500 futures are up 7 and DOW futures are up 45 (fair value).
Oil prices were up over the last week with WTI futures at $82.82 per barrel and Brent at $86.24 per barrel. A year ago, WTI was at $92, and Brent was at $100 - so WTI oil prices are down about 10% year-over-year.
Here is a graph from Gasbuddy.com for nationwide gasoline prices. Nationally prices are at $3.81 per gallon. A year ago, prices were at $4.05 per gallon, so gasoline prices are down $0.24 per gallon year-over-year.
Summer Teen Employment
by Calculated Risk on 8/06/2023 09:07:00 AM
Here is a look at the percentage of teens employed over time.
The graph below shows the employment-population ratio for teens (16 to 19 years old) since 1948.
The graph is Not Seasonally Adjusted (NSA), to show the seasonal hiring of teenagers during the summer.
A few observations:
1) Although teen employment has recovered some since the great recession, overall teen employment had been trending down. This is probably because more people are staying in school (a long term positive for the economy).
2) Teen employment was significantly impacted in 2020 by the pandemic.
 Click on graph for larger image.
3) A smaller percentage of teenagers are obtaining summer employment. The seasonal spikes are smaller than in previous decades.
The teen employment-population ratio was 38.0% in July 2023, down from 38.4% in July 2022.
The teen participation rate was 43.1% in July 2023, down from 43.6% the previous July.
In general, a smaller percentage of teenagers are joining the labor force during the summer as compared to previous years. This could be because of fewer employment opportunities, or because teenagers are pursuing other activities during the summer.
4) The decline in teenager participation is one of the reasons the overall participation rate has declined (of course, the retiring baby boomers is the main reason the overall participation rate has declined over the last 20+ years).
4) The decline in teenager participation is one of the reasons the overall participation rate has declined (of course, the retiring baby boomers is the main reason the overall participation rate has declined over the last 20+ years).
Saturday, August 05, 2023
Real Estate Newsletter Articles this Week: Asking Rents Negative Year-over-year
by Calculated Risk on 8/05/2023 02:11:00 PM
At the Calculated Risk Real Estate Newsletter this week:
• Asking Rents Negative Year-over-year
• Freddie Mac House Price Index Increased in June to New High; Up 1.7% Year-over-year
• How Much will the Fannie & Freddie Conforming Loan Limit Change for 2024?
• The impact of 7% Mortgage Rates
This is usually published 4 to 6 times a week and provides more in-depth analysis of the housing market.
You can subscribe at https://calculatedrisk.substack.com/
Most content is available for free (and no Ads), but please subscribe!
Schedule for Week of August 6, 2023
by Calculated Risk on 8/05/2023 08:11:00 AM
The key reports this week are July CPI and the June Trade Deficit.
No major economic releases scheduled.
 8:30 AM: Trade Balance report for June from the Census Bureau.
 This graph shows the U.S. trade deficit, with and without petroleum, through the most recent report. The blue line is the total deficit, and the black line is the petroleum deficit, and the red line is the trade deficit ex-petroleum products.
The consensus is the trade deficit to be $65.7 billion. The U.S. trade deficit was at $69.0 Billion the previous month.
11:00 AM: NY Fed: Q2 Quarterly Report on Household Debt and Credit
7:00 AM ET: The Mortgage Bankers Association (MBA) will release the results for the mortgage purchase applications index.
8:30 AM: The initial weekly unemployment claims report will be released. The consensus is for 236 thousand initial claims, up from 227 thousand last week.
8:30 AM: The Consumer Price Index for July from the BLS. The consensus is for a 0.2% increase in CPI, and a 0.2% increase in core CPI. The consensus is for CPI to be up 3.2% year-over-year and core CPI to be up 4.8% YoY.
12:00 PM: (expected) MBA Q2 National Delinquency Survey
8:30 AM: The Producer Price Index for July from the BLS. The consensus is for a 0.2% increase in PPI, and a 0.2% increase in core PPI.
10:00 AM: University of Michigan's Consumer sentiment index (Preliminary for August)
Friday, August 04, 2023
Aug 4th COVID Update: New Pandemic Low for Deaths
by Calculated Risk on 8/04/2023 08:16:00 PM
 Note: Mortgage rates are from MortgageNewsDaily.com and are for top tier scenarios.
Due to changes at the CDC, weekly cases are no longer updated.
After the first few weeks, the pandemic low for weekly deaths had been the week of July 7, 2021, at 1,690 deaths (until recently).
For COVID hospitalizations, the previous low was 9,821 (until recently). Recently hospitalizations have been increasing from a low of 5,300.
The last few months have seen a positive trend.
| COVID Metrics | ||||
|---|---|---|---|---|
| Now | Week Ago | Goal | ||
| Hospitalized2🚩 | 6,121 | 5,686 | ≤3,0001 | |
| Deaths per Week2 | 426 | 437 | ≤3501 | |
| 1my goals to stop weekly posts, 2Weekly for Currently Hospitalized, and Deaths 🚩 Increasing number weekly for Hospitalized and Deaths ✅ Goal met. | ||||
 Click on graph for larger image.
This graph shows the weekly (columns) number of deaths reported.
For deaths, I'm currently using 3 weeks ago for "now", since the most recent two weeks will be revised significantly.
The impact of 7% Mortgage Rates
by Calculated Risk on 8/04/2023 01:48:00 PM
Today, in the Calculated Risk Real Estate Newsletter: The impact of 7% Mortgage Rates
A brief excerpt:
The following table is from the Freddie Mac’s primary mortgage market survey (PMMS)..There is much more in the article. You can subscribe at https://calculatedrisk.substack.com/
Existing home sales bottomed in December 2022 and January 2023 on a seasonally adjusted annual rate (SAAR) basis. Those closed sales were for contracts signed mostly in the October through December timeframe when rates were the highest.
The recent surge in rates started in June, and if there is an impact on sales from higher mortgage rates, it will likely impact closed sales in the August through October timeframe. We will know about July sales very soon as local market data is released.
There will likely be less of an impact on new home sales since homebuilders will offer various incentives and mortgage rate buydowns (3-2-1 is fairly common - with the homebuilder buying the rate down by 3 percentage points in year 1, 2 percentage points in year 2, and 1 percentage point in year 3).

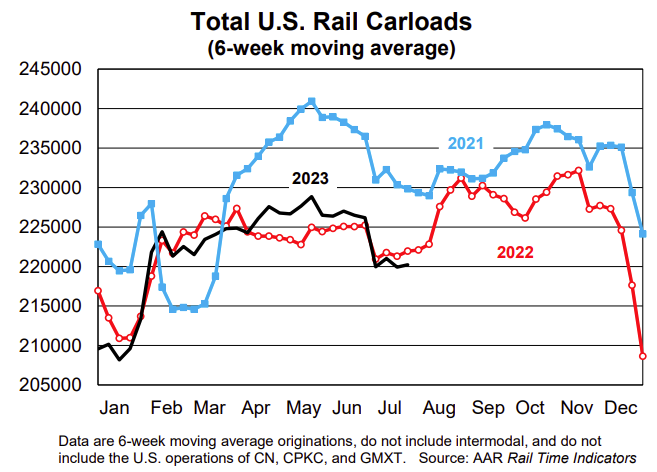
AAR: July Rail Carloads and Intermodal Decreased Year-over-year
by Calculated Risk on 8/04/2023 01:05:00 PM
From the Association of American Railroads (AAR) Rail Time Indicators. Graphs and excerpts reprinted with permission.
The July 4th holiday complicates an analysis of U.S. rail volumes in July, but there were some encouraging signs.
For example, the three non-July 4 weeks in July were the three highest-volume intermodal weeks of the year for U.S. railroads. Intermodal in July 2023 was still down 5.5% from July 2022, but that’s the smallest percentage decline for any month so far this year.
emphasis added
 Click on graph for larger image.
This graph from the Rail Time Indicators report shows the six-week average of U.S. Carloads in 2021, 2022 and 2022:
U.S. railroads originated 875,660 total carloads in July 2023, down 0.6% from July 2022 and their second straight small decline. Carloads averaged 218,915 per week in July 2023, the fewest for any month so far in 2023. July 4th is a big reason for that — the week of July 4th is always one of the lowest-volume weeks of the year. .
 The second graph shows the six-week average (not monthly) of U.S. intermodal in 2021, 2022 and 2023: (using intermodal or shipping containers):
U.S. intermodal volume averaged 241,888 containers and trailers per week in July 2023, down 5.5% from July 2022 and the 23rd decline in the past 24 months. July’s percentage decline was the smallest so far this year. The three non-July 4 weeks in July were the three highest-volume intermodal weeks of the year, which could be a hopeful sign for the future.
Comments on July Employment Report
by Calculated Risk on 8/04/2023 09:20:00 AM
The headline jobs number in the July employment report was slightly below expectations, however, employment for the previous two months was revised down by 49,000, combined. The participation rate was unchanged, and the employment population ratio increased slightly, and the unemployment rate decreased to 3.5%.
Leisure and hospitality gained 17 thousand jobs in July. At the beginning of the pandemic, in March and April of 2020, leisure and hospitality lost 8.2 million jobs, and are now down 352 thousand jobs since February 2020. So, leisure and hospitality has now added back about 96% all of the jobs lost in March and April 2020.
Construction employment increased 19 thousand and is now 363 thousand above the pre-pandemic level.
Manufacturing employment decreased 2 thousand jobs and is now 200 thousand above the pre-pandemic level.
In July, the year-over-year employment change was 3.36 million jobs.
Prime (25 to 54 Years Old) Participation
 Since the overall participation rate is impacted by both cyclical (recession) and demographic (aging population, younger people staying in school) reasons, here is the employment-population ratio for the key working age group: 25 to 54 years old.
The 25 to 54 participation rate decreased in July to 83.4% from 83.5% in June, and the 25 to 54 employment population ratio was unchanged at 80.9% from 80.9% the previous month.
Both are above the pre-pandemic levels and suggest all of the prime age workers have returned to the labor force.
Average Hourly Wages
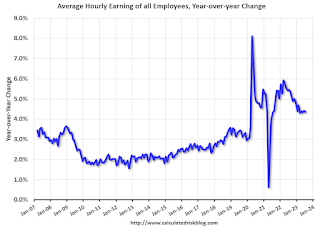 The graph shows the nominal year-over-year change in "Average Hourly Earnings" for all private employees from the Current Employment Statistics (CES).
Average Hourly Wages
 The graph shows the nominal year-over-year change in "Average Hourly Earnings" for all private employees from the Current Employment Statistics (CES).
 There was a huge increase at the beginning of the pandemic as lower paid employees were let go, and then the pandemic related spike reversed a year later.
Wage growth has trended down after peaking at 5.9% YoY in March 2022 and was at 4.4% YoY in July.
Wage growth has trended down after peaking at 5.9% YoY in March 2022 and was at 4.4% YoY in July.
Part Time for Economic Reasons
 From the BLS report:
"The number of persons employed part time for economic reasons, at 4.0 million, changed little in July. These individuals, who would have preferred full-time employment, were working part time because their hours had been reduced or they were unable to find full-time jobs."The number of persons working part time for economic reasons decreased in July to 4.00 million from 4.19 million in June. This is below pre-recession levels.
These workers are included in the alternate measure of labor underutilization (U-6) that decreased to 6.7% from 6.9% in the previous month. This is down from the record high in April 22.9% and up from the lowest level on record (seasonally adjusted) in December 2022 (6.5%). (This series started in 1994). This measure is below the 7.0% level in February 2020 (pre-pandemic).
Unemployed over 26 Weeks
 This graph shows the number of workers unemployed for 27 weeks or more.
 According to the BLS, there are 1.164 million workers who have been unemployed for more than 26 weeks and still want a job, down from 1.105 million the previous month.
This is at pre-pandemic levels.
Summary:
The headline monthly jobs number was slightly below consensus expectations; however, May and June payrolls were revised down by 49,000 combined.
Job growth has slowed to a somewhat more normal pace, up at a 2.7 million annual rate over the last 6 months. Overall, this was another solid employment report.


