by Calculated Risk on 8/09/2023 07:00:00 AM
Wednesday, August 09, 2023
MBA: Mortgage Applications Decreased in Weekly Survey
From the MBA: Mortgage Applications Decrease in Latest MBA Weekly Survey
Mortgage applications decreased 3.1 percent from one week earlier, according to data from the Mortgage Bankers Association’s (MBA) Weekly Mortgage Applications Survey for the week ending August 4, 2023.
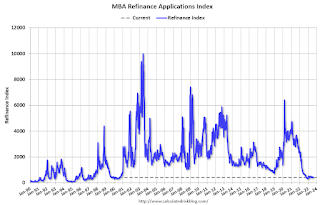
The Market Composite Index, a measure of mortgage loan application volume, decreased 3.1 percent on a seasonally adjusted basis from one week earlier. On an unadjusted basis, the Index decreased 4 percent compared with the previous week. The Refinance Index decreased 4 percent from the previous week and was 37 percent lower than the same week one year ago. The seasonally adjusted Purchase Index decreased 3 percent from one week earlier. The unadjusted Purchase Index decreased 3 percent compared with the previous week and was 27 percent lower than the same week one year ago.
“Treasury yields rates rose last week and mortgage rates followed suit, due to a combination of the Treasury’s funding announcement and the downgrading of the U.S. government debt rating. Rates increased for all loan types in our survey, with the 30-year fixed mortgage rate increasing to 7.09 percent, the highest level since November 2022,” said Joel Kan, MBA’s Vice President and Deputy Chief Economist. “Additionally, the rate for FHA mortgages increased to 7.02 percent, the highest rate since 2002. Not surprisingly, mortgage applications continued to decline given these higher rates, with overall application counts falling for the third consecutive week, as both purchase and refinance activity declined. The purchase index fell for the fourth consecutive week, as homebuyers continue to struggle with low for-sale inventory and elevated mortgage rates.”
...
The average contract interest rate for 30-year fixed-rate mortgages with conforming loan balances ($726,200 or less) increased to 7.09 percent from 6.93 percent, with points increasing to 0.70 from 0.68 (including the origination fee) for 80 percent loan-to-value ratio (LTV) loans.
emphasis added
 Click on graph for larger image.
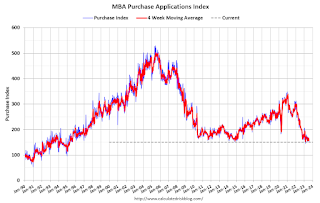
The first graph shows the MBA mortgage purchase index.
According to the MBA, purchase activity is down 27% year-over-year unadjusted.
Tuesday, August 08, 2023
Wednesday: MBA Mortgage Applications
by Calculated Risk on 8/08/2023 09:05:00 PM

Wednesday:
• At 7:00 AM ET, The Mortgage Bankers Association (MBA) will release the results for the mortgage purchase applications index.
Leading Index for Commercial Real Estate Decreased in July
by Calculated Risk on 8/08/2023 02:42:00 PM
From Dodge Data Analytics: Dodge Momentum Index Recedes 1% in July
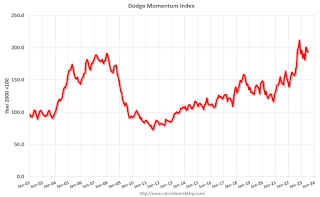
The Dodge Momentum Index (DMI), issued by Dodge Construction Network, declined 0.9% in July to 193.4 (2000=100) from the revised June reading of 195.1. Over the month, the commercial component of the DMI remained relatively flat, ticking down 0.2%, while the institutional component fell 1.9%.
“While both segments of the Index fell this month, underlying project data points to divergent trends in the nonresidential sector,” said Sarah Martin, associate director of forecasting for Dodge Construction Network. “In comparison to January 2023, commercial planning activity is down 10% through July, while institutional planning is up 16%. Distinctly large institutional projects entering planning in May temporarily inflated month-to-month trends, but activity has since ticked down. As we progress through the remainder of 2023, weaker commercial activity, resulting from tighter lending standards and higher interest rates, will counter sturdier institutional activity, bolstered by public funding and less sensitivity to interest rates.”
All commercial sectors pulled back, or remained flat, over the month of July. Hotel planning saw the largest month-over-month decay, marking four months of consecutive decline in the sector. July also saw a deceleration in the number of education and healthcare projects entering planning — the two largest institutional segments.
...
The DMI is a monthly measure of the initial report for nonresidential building projects in planning, shown to lead construction spending for nonresidential buildings by a full year.
emphasis added
 Click on graph for larger image.
This graph shows the Dodge Momentum Index since 2002. The index was at 193.4 in July, down from 195.1 the previous month.
According to Dodge, this index leads "construction spending for nonresidential buildings by a full year". This index suggests some slowdown towards the end of 2023 or in 2024.
1st Look at Local Housing Markets in July
by Calculated Risk on 8/08/2023 11:30:00 AM
Today, in the Calculated Risk Real Estate Newsletter: 1st Look at Local Housing Markets in July
A brief excerpt:
This is the first look at several early reporting local markets in July. I’m tracking about 40 local housing markets in the US. Some of the 40 markets are states, and some are metropolitan areas. I’ll update these tables throughout the month as additional data is released.There is much more in the article. You can subscribe at https://calculatedrisk.substack.com/
Closed sales in July were mostly for contracts signed in May and June. Since 30-year fixed mortgage rates were in the 6.4% range in May, and 6.7% in June, compared to the low-to-mid 5% range the previous year, closed sales were down year-over-year in July.
...
In July, sales in these markets were down 14.5%. In June, these same markets were down 20.5% YoY Not Seasonally Adjusted (NSA).
This is a smaller YoY decline NSA than in June for these early reporting markets. Note that there were the same number of selling days each year in July 2022 and July 2023.
A key factor in the smaller YoY decline was that sales were steadily declining last year due to higher mortgage rates. ...
This was just several early reporting markets. Many more local markets to come!
NY Fed Q2 Report: Household Debt Increased Slightly, Mortgage Balances "Unchanged"
by Calculated Risk on 8/08/2023 11:13:00 AM
From the NY Fed: Total Household Debt Reaches $17.06 Trillion in Q2 2023; Credit Card Debt Exceeds $1 Trillion
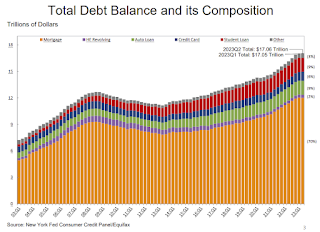
The Federal Reserve Bank of New York's Center for Microeconomic Data today issued its Quarterly Report on Household Debt and Credit. The report shows a slight uptick in total household debt in the second quarter of 2023, increasing by $16 billion (0.1%) to $17.06 trillion. The report is based on data from the New York Fed’s nationally representative Consumer Credit Panel.
Credit card balances increased by $45 billion, from $986 billion in Q1 2023 to a series high of $1.03 trillion in the Q2 2023, marking a 4.6% quarterly increase. Credit card accounts expanded by 5.48 million to 578.35 million. Aggregate limits on credit card accounts increased by $9 billion and now stand at $4.6 trillion.
Mortgage balances were largely unchanged from the previous quarter and stood at $12.01 trillion at the end of June, in large part due to declining mortgage originations and slowing home prices. Mortgage originations, which include refinances, stood at $393 billion in the second quarter, representing a $70 billion increase from the first quarter. Other balances, which include retail cards and other consumer loans, increased by $15 billion.
Auto loan balances rose by $20 billion, consistent with the upward trajectory seen since 2011. The volume of newly originated auto loans, which includes leases, was $179 billion, largely reflecting high dollar values of originated loans even as the number of newly opened loans remains below pre-pandemic levels. Student loan balances fell by $35 billion and stood at $1.57 trillion.
Delinquency rates were roughly flat in the second quarter of 2023 and remained low, after declining sharply since the beginning of the pandemic. The share of debt newly transitioning into delinquency increased for credit cards and auto loans, with increases in transition rates of 0.7 and 0.4 percentage points respectively.
emphasis added
 Click on graph for larger image.
Here are three graphs from the report:
The first graph shows household debt increased slightly in Q2. Household debt previously peaked in 2008 and bottomed in Q3 2013. Unlike following the great recession, there wasn't a decline in debt during the pandemic.
From the NY Fed:
Aggregate household debt balances increased by $16 billion in the second quarter of 2023, a 0.1% rise from 2023Q1. Balances now stand at $17.06 trillion and have increased by $2.9 trillion since the end of 2019, just before the pandemic recession.
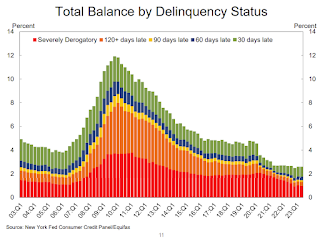 The second graph shows the percent of debt in delinquency.
The overall delinquency rate "roughly flat" in Q2. From the NY Fed:
Aggregate delinquency rates were roughly flat in the second quarter of 2023 and remained low, after declining sharply through the beginning of the pandemic. As of June, 2.7% of outstanding debt was in some stage of delinquency, 2 percentage points lower than the last quarter of 2019, just before the COVID-19 pandemic hit the United States.
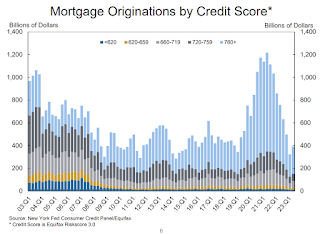 The third graph shows Mortgage Originations by Credit Score.
From the NY Fed:
Mortgage originations, measured as appearances of new mortgages on consumer credit reports and including both refinance and purchase originations, were at $393 billion in 2023Q2, an uptick from the 9-year low observed in the previous quarter. ... The median credit score for newly originated mortgages increased by 4 points, to 769.There is much more in the report.
Trade Deficit Decreased to $65.5 Billion in June
by Calculated Risk on 8/08/2023 08:30:00 AM
The Census Bureau and the Bureau of Economic Analysis reported:
The U.S. Census Bureau and the U.S. Bureau of Economic Analysis announced today that the goods and services deficit was $65.5 billion in June, down $2.8 billion from $68.3 billion in May, revised.
June exports were $247.5 billion, $0.3 billion less than May exports. June imports were $313.0 billion, $3.1 billion less than May imports.
emphasis added
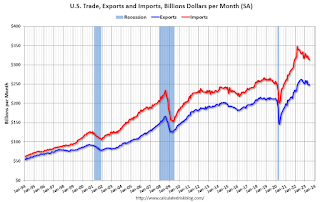 Click on graph for larger image.
Exports and imports decreased in June.
Exports are down 4% year-over-year; imports are down 8% year-over-year.
Both imports and exports decreased sharply due to COVID-19 and then bounced back - and both have been decreasing recently.
The second graph shows the U.S. trade deficit, with and without petroleum.
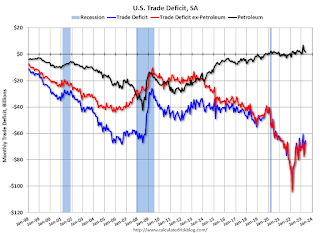 The blue line is the total deficit, and the black line is the petroleum deficit, and the red line is the trade deficit ex-petroleum products.
Note that net, exports of petroleum products are positive and have picked up.
The trade deficit with China decreased to $24.1 billion from $37.0 billion a year ago.
Monday, August 07, 2023
Tuesday: Trade Deficit, Q2 Household Debt and Credit
by Calculated Risk on 8/07/2023 07:56:00 PM
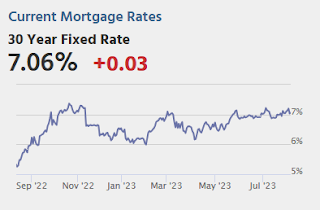
Mortgage rates are starting out the new week at modestly higher levels compared to last Friday afternoon. The average change is very small. Many borrowers would see no difference in today's rate quotes. A few lenders are marginally improved from Friday, but they generally hadn't improved as much as other lenders on Friday itself.Tuesday:
Top tier conventional 30yr fixed scenarios are still over 7% either way. ... Thursday's release of the Consumer Price Index (CPI) is this week's highest risk/reward event. [30 year fixed 7.06%]
emphasis added
• At 8:30 AM ET, Trade Balance report for June from the Census Bureau. The consensus is the trade deficit to be $65.7 billion. The U.S. trade deficit was at $69.0 Billion the previous month.
• At 11:00 AM, NY Fed: Q2 Quarterly Report on Household Debt and Credit
Second Home Market: South Lake Tahoe in July; Prices Down 6.3% YoY
by Calculated Risk on 8/07/2023 01:49:00 PM
With the pandemic, there was a surge in 2nd home buying.
I'm looking at data for some second home markets - and I'm tracking those markets to see if there is an impact from lending changes, rising mortgage rates or the easing of the pandemic.
This graph is for South Lake Tahoe since 2004 through July 2023, and shows inventory (blue), and the year-over-year (YoY) change in the median price (12-month average).
Note: The median price is a 12-month average, and is distorted by the mix, but this is the available data.

Following the housing bubble, prices declined for several years in South Lake Tahoe, with the median price falling about 50% from the bubble peak.
Currently active inventory is still very low and is down 28% year-over-year.
Black Knight Mortgage Monitor: Home Prices Increased Month-to-month to New Record High in June
by Calculated Risk on 8/07/2023 10:23:00 AM
Today, in the Calculated Risk Real Estate Newsletter: Black Knight Mortgage Monitor: Home Prices Increased Month-to-month to New Record High in June
A brief excerpt:
Note: Although not in Mortgage Monitor, Black Knight told me: “We haven’t yet calculated payment-to-income ratios given yesterday’s news of rates north of 7%, but it’s a pretty safe bet it’s pushed us past last October/November’s “worst affordable market” marker"There is much more in the article. You can subscribe at https://calculatedrisk.substack.com/
...
Note: The Black Knight House Price Index (HPI) is a repeat sales index. Black Knight reports the median price change of the repeat sales. Here is a graph of the Black Knight HPI. The index is up 0.8% year-over-year.
• Home prices grew by a seasonally adjusted +0.67% in the month, slightly cooler than the +0.8% seen in May, but on par with the +0.7 and +0.69% seasonally adjusted growth in March and April
• Recent monthly gains suggest that further acceleration of annual home price growth rates are likely on the horizonbr />
• A continuation of gains seen over the past six months (+0.6% month over month, seasonally adjusted, on average) would result in the annual home price growth rate accelerating to 2% or higher in July with further acceleration in subsequent monthsbr />
• A later-than-normal peak in inventory levels, as noted on the previous page, could ease price pressures later this year, although if interest rates begin to ease, prices could heat up on what would still be chronically low inventory
emphasis added
Wholesale Used Car Prices Decreased 1.6% in July; Down 11.6% Year-over-year
by Calculated Risk on 8/07/2023 10:07:00 AM
From Manheim Consulting today: Wholesale Used-Vehicle Prices See Large Decline in June
Wholesale used-vehicle prices (on a mix, mileage, and seasonally adjusted basis) decreased 1.6% in July from June. The Manheim Used Vehicle Value Index (MUVVI) declined to 211.7, down 11.6% from a year ago.
“The July drop of 1.6% is an indicator of slowing wholesale price declines, at least when compared to the month-over-month losses we’ve seen since April,” said Chris Frey, senior manager of Economic and Industry Insights for Cox Automotive. “While the year-over-year price drop was again double-digit, let’s put some perspective on that. From July 2020, there were 22 straight monthly double-digit increases through April 2022; we’ve had just six double-digit declines since October last year, with only four of them consecutive. Keeping to the April theme, we’re now back to the same index value last seen in April 2021: 211.7. Used retail inventory continues to rebuild; but with used retail sales also showing some summer strength, we do not foresee wholesale price declines of serious import through December.”
July’s decrease was softened by the seasonal adjustment. The non-adjusted price change in July decreased by 3.8% compared to June, moving the unadjusted average price down 10.7% year over year.
emphasis added
 Click on graph for larger image.
This index from Manheim Consulting is based on all completed sales transactions at Manheim’s U.S. auctions.


