 RSS Feed
 by Calculated Risk on 8/10/2023 08:59:00 PM
Thursday, August 10, 2023
Friday: PPI
 Note: Mortgage rates are from MortgageNewsDaily.com and are for top tier scenarios.
Friday:
• At 8:30 AM ET, The Producer Price Index for July from the BLS. The consensus is for a 0.2% increase in PPI, and a 0.2% increase in core PPI.
• At 10:00 AM, University of Michigan's Consumer sentiment index (Preliminary for August)
The Long-Term Housing and Population Shift
by Calculated Risk on 8/10/2023 01:40:00 PM
Today, in the Calculated Risk Real Estate Newsletter: The Long-Term Housing and Population Shift
A brief excerpt:
Something different …There is much more in the article. You can subscribe at https://calculatedrisk.substack.com/
Here is a look at the last 50 to 60 years, and some predictions about the next 50+ years.
First, here is a graph from the Census Bureau showing the Median Center of Population for the United States: 1880 to 2020
A key driver of the westward movement was the availability of water, and this boosted population growth in California, and in several other states like Arizona, and Nevada. The population California increased 150% from 1960 to 2020, and Arizona’s population increased more than five-fold. Nevada’s population increased more than ten-fold! (For comparison, the US population increased 85% from 1960 to 2020).
The key driver of the southward movement was Air Conditioning! AC has made the Southern States and D.C. more habitable year-round (Arizona and Nevada benefited from both additional water supply and AC).
...
If you were a home builder 50 years ago, you’d start concentrating on building in the West and all across the South to take advantage of this shift.
But what about the next 50 years?

Cleveland Fed: Median CPI increased 0.2% and Trimmed-mean CPI increased 0.2% in July
by Calculated Risk on 8/10/2023 12:58:00 PM
The Cleveland Fed released the median CPI and the trimmed-mean CPI.
According to the Federal Reserve Bank of Cleveland, the median Consumer Price Index rose 0.2% in July. The 16% trimmed-mean Consumer Price Index also increased 0.2% in July. "The median CPI and 16% trimmed-mean CPI are measures of core inflation calculated by the Federal Reserve Bank of Cleveland based on data released in the Bureau of Labor Statistics’ (BLS) monthly CPI report".
 Click on graph for larger image.
This graph shows the year-over-year change for these four key measures of inflation.
On a year-over-year basis, the median CPI rose 6.1% (down from 6.4% in June), the trimmed-mean CPI rose 4.8% (down from 5.0%), and the CPI less food and energy rose 5.0%. Core PCE is for May and increased 4.7% year-over-year (down from 5.0%).
Core PCE is for June was up 4.1% YoY, down from 4.6% in May.
Note: The Cleveland Fed released the median CPI details. "Fuel oil and other fuels" increased at a 54% annualized rate in July.
YoY Measures of Inflation: Services, Goods and Shelter
by Calculated Risk on 8/10/2023 11:54:00 AM
Here are a few measures of inflation:
The first graph is the one Fed Chair Powell had mentioned when services less rent of shelter was up 7.6% year-over-year. This has fallen sharply and is now up 3.3% YoY.
 Click on graph for larger image.
This graph shows the YoY price change for Services and Services less rent of shelter through July 2023.
Services were up 5.7% YoY as of July 2023, from 5.7% YoY in June.
Services less rent of shelter was up 3.3% YoY in July, up from 3.2% YoY in June.
Services less rent of shelter was up 3.3% YoY in July, up from 3.2% YoY in June.
Earlier this year, a key question was: Would services ex-shelter inflation be persistent, or would it follow a similar pattern as goods? This is a topic I discussed in Pandemic Economics, Housing and Monetary Policy: Part 2.
 The second graph shows that goods prices started to increase year-over-year (YoY) in 2020 and accelerated in 2021 due to both strong demand and supply chain disruptions.
 The second graph shows that goods prices started to increase year-over-year (YoY) in 2020 and accelerated in 2021 due to both strong demand and supply chain disruptions.
Durables were at -1.4% YoY as of July 2023, down from -0.8% YoY in June.
Commodities less food and energy commodities were up 0.9% YoY in July, down from 1.4% YoY in June.
Commodities less food and energy commodities were up 0.9% YoY in July, down from 1.4% YoY in June.
Goods inflation was transitory.
 Here is a graph of the year-over-year change in shelter from the CPI report (through July) and housing from the PCE report (through June 2023)
Shelter was up 7.7% year-over-year in July, down from 7.8% in June. Housing (PCE) was up 8.0% YoY in June, down from 8.3% in May.
The BLS noted this morning: "The index for shelter was by far the largest contributor to the monthly all items increase, accounting for over 90 percent of the increase, with the index for motor vehicle insurance also contributing."
MBA: "Mortgage Delinquencies Decrease in the Second Quarter of 2023"; Lowest Level on Record
by Calculated Risk on 8/10/2023 10:20:00 AM
From the MBA: Mortgage Delinquencies Decrease in the Second Quarter of 2023
The delinquency rate for mortgage loans on one-to-four-unit residential properties decreased to a seasonally adjusted rate of 3.37 percent of all loans outstanding at the end of the second quarter of 2023, according to the Mortgage Bankers Association’s (MBA) National Delinquency Survey.
The delinquency rate was down 19 basis points from the first quarter of 2023 and down 27 basis points from one year ago. The percentage of loans on which foreclosure actions were started in the second quarter fell by 3 basis points to 0.13 percent.
“The seasonally-adjusted mortgage delinquency rate fell to its lowest level since MBA’s survey began in 1979, reaching 3.37 percent in the second quarter of 2023,” said Marina Walsh, CMB, MBA’s Vice President of Industry Analysis. “Buoyed by a resilient job market, homeowners are continuing to make their mortgage payments.”
Walsh noted that delinquencies fell across all mortgage types – conventional, FHA, and VA. Both foreclosure starts and foreclosure inventory also declined relative to the previous quarter.
Added Walsh, “Despite low delinquency rates, there are early signs of possible consumer credit stress. Delinquencies are rising for other forms of credit such as credit cards and car loans[1]. In addition, FHA delinquencies rose 10 basis points compared to year ago levels. On a non-seasonally adjusted basis, FHA delinquencies rose 13 basis points year-over-year and 71 basis points from the first quarter of 2023. As the economy slows and labor market cools, homeowners with FHA loans are likely to feel the distress first.”
emphasis added
 Click on graph for larger image.
This graph shows the percent of loans delinquent by days past due. Overall delinquencies decreased in Q2.
From the MBA:
Compared to last quarter, the seasonally adjusted mortgage delinquency rate decreased for all loans outstanding. By stage, the 30-day delinquency rate decreased 2 basis points to 1.75 percent, the 60-day delinquency rate remained unchanged at 0.55 percent, and the 90-day delinquency bucket decreased 17 basis points to 1.07 percent.The sharp increase in 2020 in the 90-day bucket was due to loans in forbearance (included as delinquent, but not reported to the credit bureaus).
...
The delinquency rate includes loans that are at least one payment past due but does not include loans in the process of foreclosure. The percentage of loans in the foreclosure process at the end of the second quarter was 0.53 percent, down 4 basis points from the first quarter of 2023 and 6 basis points lower than one year ago.
The percent of loans in the foreclosure process decreased slightly year-over-year in Q2 even with the end of the foreclosure moratoriums and are historically low.
Weekly Initial Unemployment Claims Increase to 248,000
by Calculated Risk on 8/10/2023 08:54:00 AM
The DOL reported:
In the week ending August 5, the advance figure for seasonally adjusted initial claims was 248,000, an increase of 21,000 from the previous week's unrevised level of 227,000. The 4-week moving average was 231,000, an increase of 2,750 from the previous week's unrevised average of 228,250.The following graph shows the 4-week moving average of weekly claims since 1971.
emphasis added
 Click on graph for larger image.
The dashed line on the graph is the current 4-week average. The four-week average of weekly unemployment claims increased to 231,000.
The previous week was unrevised.
Weekly claims were above the consensus forecast.
BLS: CPI increased 0.2% in July; Core CPI increased 0.2%
by Calculated Risk on 8/10/2023 08:30:00 AM
The Consumer Price Index for All Urban Consumers (CPI-U) rose 0.2 percent in July on a seasonally adjusted basis, the same increase as in June, the U.S. Bureau of Labor Statistics reported today. Over the last 12 months, the all items index increased 3.2 percent before seasonal adjustment.CPI and core CPI were at expectations. I'll post a graph later today after the Cleveland Fed releases the median and trimmed-mean CPI.
The index for shelter was by far the largest contributor to the monthly all items increase, accounting for over 90 percent of the increase, with the index for motor vehicle insurance also contributing. The food index increased 0.2 percent in July after increasing 0.1 percent the previous month. The index for food at home increased 0.3 percent over the month while the index for food away from home rose 0.2 percent in July. The energy index rose 0.1 percent in July as the major energy component indexes were mixed.
The index for all items less food and energy rose 0.2 percent in July, as it did in June. Indexes which increased in June include shelter, motor vehicle insurance, education, and recreation. The indexes for airline fares, used cars and trucks, medical care, and communication were among those that decreased over the month.
The all items index increased 3.2 percent for the 12 months ending July, slightly more than the 3.0-percent increase for the 12 months ending in June. The all items less food and energy index rose 4.7 percent over the last 12 months. The energy index decreased 12.5 percent for the 12 months ending July, and the food index increased 4.9 percent over the last year.
emphasis added
Wednesday, August 09, 2023
Thursday: CPI, Unemployment Claims
by Calculated Risk on 8/09/2023 08:49:00 PM
 Note: Mortgage rates are from MortgageNewsDaily.com and are for top tier scenarios.
Thursday:
• At 8:30 AM ET, The initial weekly unemployment claims report will be released. The consensus is for 236 thousand initial claims, up from 227 thousand last week.
• Also at 8:30 AM, The Consumer Price Index for July from the BLS. The consensus is for a 0.2% increase in CPI, and a 0.2% increase in core CPI. The consensus is for CPI to be up 3.2% year-over-year and core CPI to be up 4.8% YoY.
• At 12:00 PM,: (expected) MBA Q2 National Delinquency Survey
Oops. Wrong Graph Last Friday for 25- to 54-Years-Old Participation Rate
by Calculated Risk on 8/09/2023 04:06:00 PM
Last Friday I posted the incorrect chart for the 25 to 54 employment-population ratio and participation rate (ht Kevin). Here is the correct graph.
Prime (25 to 54 Years Old) Participation
 Since the overall participation rate is impacted by both cyclical (recession) and demographic (aging population, younger people staying in school) reasons, here is the employment-population ratio for the key working age group: 25 to 54 years old.
The 25 to 54 participation rate decreased in July to 83.4% from 83.5% in June, and the 25 to 54 employment population ratio was unchanged at 80.9% from 80.9% the previous month.
Both are above the pre-pandemic levels and suggest all of the prime age workers have returned to the labor force.
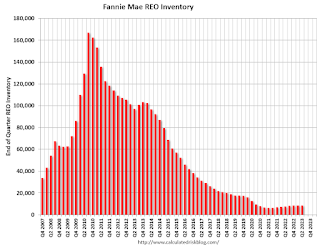
Fannie "Real Estate Owned" inventory Decreased in Q2
by Calculated Risk on 8/09/2023 03:47:00 PM
Fannie reported results for Q2 2023. Here is some information on single-family Real Estate Owned (REOs).
Fannie Mae reported the number of REOs decreased to 8,615 at the end of Q2 2023, down from 8,780 in Q1 2022, and up 13% from 7,637 at the end of Q2 2022.
For Fannie, this is down 95% from the 166,787 peak number of REOs in Q3 2010.
 Click on graph for larger image.
Here is a graph of Fannie Real Estate Owned (REO).
This is well below a normal level of REOs for Fannie, and REO levels will increase further in 2023, but there will not be a huge wave of foreclosures.
 Click on graph for larger image.
Here is a graph of Fannie Real Estate Owned (REO).
This is well below a normal level of REOs for Fannie, and REO levels will increase further in 2023, but there will not be a huge wave of foreclosures.

In Memoriam: Doris "Tanta" Dungey


| Privacy Policy |
| Copyright © 2007 - 2025 CR4RE LLC |
| Excerpts NOT allowed on x.com |