by Calculated Risk on 8/12/2023 08:11:00 AM
Saturday, August 12, 2023
Schedule for Week of August 13, 2023
The key reports this week are July Retail Sales and Housing Starts.
For manufacturing, the Industrial Production report will be released.
No major economic releases scheduled.
 8:30 AM: Retail sales for July is scheduled to be released. The consensus is for 0.4% increase in retail sales.
This graph shows retail sales since 1992. This is monthly retail sales and food service, seasonally adjusted (total and ex-gasoline)
8:30 AM: The New York Fed Empire State manufacturing survey for August. The consensus is for a reading of -0.7, down from 1.1.
10:00 AM: The August NAHB homebuilder survey. The consensus is for a reading of 56, unchanged from 56. Any number above 50 indicates that more builders view sales conditions as good than poor.
7:00 AM ET: The Mortgage Bankers Association (MBA) will release the results for the mortgage purchase applications index.
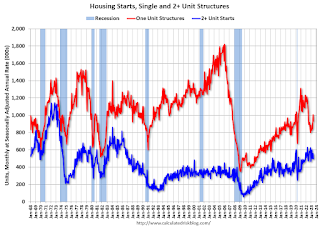 8:30 AM ET: Housing Starts for July.
 This graph shows single and multi-family housing starts since 1968.
The consensus is for 1.440 million SAAR, up from 1.434 million SAAR in June.
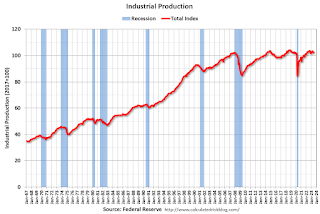 9:15 AM: The Fed will release Industrial Production and Capacity Utilization for July.
This graph shows industrial production since 1967.
The consensus is for a 0.3% increase in Industrial Production, and for Capacity Utilization to increase to 79.2%.
2:00 PM: FOMC Minutes, Meeting of July 25-26, 2023
8:30 AM: The initial weekly unemployment claims report will be released. The consensus is for 256 thousand initial claims, up from 248 thousand last week.
8:30 AM: the Philly Fed manufacturing survey for August. The consensus is for a reading of -10.0, up from -13.5.
10:00 AM: State Employment and Unemployment (Monthly) for July 2023
Friday, August 11, 2023
Aug 11th COVID Update: New Pandemic Low for Deaths
by Calculated Risk on 8/11/2023 08:02:00 PM
| COVID Metrics | ||||
|---|---|---|---|---|
| Now | Week Ago | Goal | ||
| Hospitalized2🚩 | 6,829 | 6,151 | ≤3,0001 | |
| Deaths per Week2 | 437 | 473 | ≤3501 | |
| 1my goals to stop weekly posts, 2Weekly for Currently Hospitalized, and Deaths 🚩 Increasing number weekly for Hospitalized and Deaths ✅ Goal met. | ||||
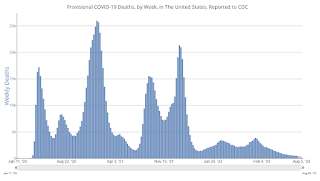 Click on graph for larger image.
This graph shows the weekly (columns) number of deaths reported.
Realtor.com Reports Weekly Active Inventory Down 9% YoY; New Listings Down 14% YoY
by Calculated Risk on 8/11/2023 01:58:00 PM
Realtor.com has monthly and weekly data on the existing home market. Here is their weekly report from Danielle Hale: Weekly Housing Trends View — Data Week Ending Aug 5, 2023
• Active inventory declined, with for-sale homes lagging behind year ago levels by 9%.. This week marks a 7th consecutive decline in the number of homes actively for sale compared to the prior year, and the gap is growing.
• New listings–a measure of sellers putting homes up for sale–were down again this week, by 14% from one year ago. For 57 weeks, there have been fewer newly listed homes compared to the same time one year ago. The gap is starting to shrink as we get into a comparison against low new listings in the second half of 2022. This week’s data shows a 2.5 percentage point improvement over last week as the market slowly trends in a buyer-friendly direction, reflecting a stabilization of the low new listings count.
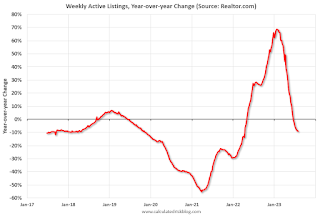 Here is a graph of the year-over-year change in inventory according to realtor.com.
 Inventory was down 9.1% year-over-year - this was the seventh consecutive week with a YoY decrease following 58 consecutive weeks with a YoY increase in inventory.
Early Q3 GDP Tracking: Wide Range
by Calculated Risk on 8/11/2023 12:58:00 PM
As usual, there is a wide range of estimates early in the quarter. GDPNow's estimate is probably way too high.
From BofA:
Next week, we will initiate our 3Q US GDP tracker with the July retail sales data.From Goldman:
emphasis added
We left our Q3 GDP tracking estimate unchanged at +1.5% (qoq ar) [Aug 8th estimate]And from the Altanta Fed: GDPNow
The GDPNow model estimate for real GDP growth (seasonally adjusted annual rate) in the third quarter of 2023 is 4.1 percent on August 8, up from 3.9 percent on August 1. [Aug 8 estimate]
Part 1: Current State of the Housing Market; Overview for mid-August
by Calculated Risk on 8/11/2023 10:33:00 AM
Today, in the Calculated Risk Real Estate Newsletter: Part 1: Current State of the Housing Market; Overview for mid-August
A brief excerpt:
Interestingly, new home inventory is close to a record percentage of total inventory. This graph uses Not Seasonally Adjusted (NSA) existing home inventory from the National Association of Realtors® (NAR) and new home inventory from the Census Bureau (only completed and under construction inventory).There is much more in the article. You can subscribe at https://calculatedrisk.substack.com/
Note: Mark Fleming, Chief Economist at First American pointed this out in March.
It took a number of years following the housing bust for new home inventory to return to the pre-bubble percent of total inventory. Then, with the pandemic, existing home inventory collapsed and now the percent of new homes is close to 24% of total for sale inventory. The lack of existing home inventory, and few distressed sales, has been a positive for homebuilders.
Hotels: Occupancy Rate Down 1.0% Year-over-year
by Calculated Risk on 8/11/2023 08:15:00 AM
U.S. hotel performance declined from the previous week and showed lower comparisons year over year, according to CoStar’s latest data through 5 August. ...The following graph shows the seasonal pattern for the hotel occupancy rate using the four-week average.
30 July – 5 August 2023 (percentage change from comparable week in 2022):
• Occupancy: 68.9% (-1.0%)
• Average daily rate (ADR): US$158.10 (+2.2%)
• Revenue per available room (RevPAR): US$108.97 (+1.2%)
emphasis added
 Click on graph for larger image.
The red line is for 2023, black is 2020, blue is the median, and dashed light blue is for 2022. Dashed purple is for 2018, the record year for hotel occupancy.
Thursday, August 10, 2023
Friday: PPI
by Calculated Risk on 8/10/2023 08:59:00 PM
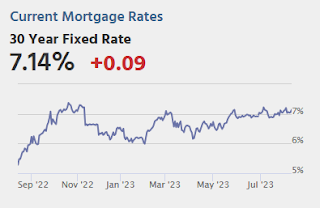
Friday:
• At 8:30 AM ET, The Producer Price Index for July from the BLS. The consensus is for a 0.2% increase in PPI, and a 0.2% increase in core PPI.
• At 10:00 AM, University of Michigan's Consumer sentiment index (Preliminary for August)
The Long-Term Housing and Population Shift
by Calculated Risk on 8/10/2023 01:40:00 PM
Today, in the Calculated Risk Real Estate Newsletter: The Long-Term Housing and Population Shift
A brief excerpt:
Something different …There is much more in the article. You can subscribe at https://calculatedrisk.substack.com/
Here is a look at the last 50 to 60 years, and some predictions about the next 50+ years.
First, here is a graph from the Census Bureau showing the Median Center of Population for the United States: 1880 to 2020
A key driver of the westward movement was the availability of water, and this boosted population growth in California, and in several other states like Arizona, and Nevada. The population California increased 150% from 1960 to 2020, and Arizona’s population increased more than five-fold. Nevada’s population increased more than ten-fold! (For comparison, the US population increased 85% from 1960 to 2020).
The key driver of the southward movement was Air Conditioning! AC has made the Southern States and D.C. more habitable year-round (Arizona and Nevada benefited from both additional water supply and AC).
...
If you were a home builder 50 years ago, you’d start concentrating on building in the West and all across the South to take advantage of this shift.
But what about the next 50 years?
Cleveland Fed: Median CPI increased 0.2% and Trimmed-mean CPI increased 0.2% in July
by Calculated Risk on 8/10/2023 12:58:00 PM
The Cleveland Fed released the median CPI and the trimmed-mean CPI.
According to the Federal Reserve Bank of Cleveland, the median Consumer Price Index rose 0.2% in July. The 16% trimmed-mean Consumer Price Index also increased 0.2% in July. "The median CPI and 16% trimmed-mean CPI are measures of core inflation calculated by the Federal Reserve Bank of Cleveland based on data released in the Bureau of Labor Statistics’ (BLS) monthly CPI report".
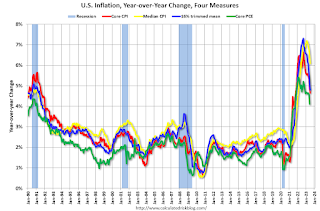 Click on graph for larger image.
This graph shows the year-over-year change for these four key measures of inflation.
Note: The Cleveland Fed released the median CPI details. "Fuel oil and other fuels" increased at a 54% annualized rate in July.
YoY Measures of Inflation: Services, Goods and Shelter
by Calculated Risk on 8/10/2023 11:54:00 AM
Here are a few measures of inflation:
The first graph is the one Fed Chair Powell had mentioned when services less rent of shelter was up 7.6% year-over-year. This has fallen sharply and is now up 3.3% YoY.

This graph shows the YoY price change for Services and Services less rent of shelter through July 2023.
Services less rent of shelter was up 3.3% YoY in July, up from 3.2% YoY in June.
 The second graph shows that goods prices started to increase year-over-year (YoY) in 2020 and accelerated in 2021 due to both strong demand and supply chain disruptions.
Commodities less food and energy commodities were up 0.9% YoY in July, down from 1.4% YoY in June.
 Here is a graph of the year-over-year change in shelter from the CPI report (through July) and housing from the PCE report (through June 2023)
Shelter was up 7.7% year-over-year in July, down from 7.8% in June. Housing (PCE) was up 8.0% YoY in June, down from 8.3% in May.
The BLS noted this morning: "The index for shelter was by far the largest contributor to the monthly all items increase, accounting for over 90 percent of the increase, with the index for motor vehicle insurance also contributing."


