 RSS Feed
 by Calculated Risk on 8/14/2023 08:11:00 AM
Monday, August 14, 2023
Housing August 14th Weekly Update: Inventory increased 0.9% Week-over-week; Down 10.5% Year-over-year
Altos reports that active single-family inventory was up 0.9% week-over-week.
 Click on graph for larger image.
This inventory graph is courtesy of Altos Research.
As of August 11th, inventory was at 492 thousand (7-day average), compared to 488 thousand the prior week.
Year-to-date, inventory is up 0.3%. And inventory is up 21.4% from the seasonal bottom 17 weeks ago.

The red line is for 2023. The black line is for 2019. Note that inventory is up from the record low for the same week in 2021, but below last year and still well below normal levels.
Inventory was down 10.5% compared to the same week in 2022 (last week it was down 10.3%), and down 48.5% compared to the same week in 2019 (last week down 49.3%).
It appears same week inventory will be below 2022 levels for the remainder of the year. It is possible that inventory will fall below the record lows in 2021 and early 2022 later this year or in early 2024, but currently that seems unlikely.
Mike Simonsen discusses this data regularly on Youtube.
Sunday, August 13, 2023
Sunday Night Futures
by Calculated Risk on 8/13/2023 06:12:00 PM
Weekend:
• Schedule for Week of August 13, 2023
Monday:
• No major economic releases scheduled.
From CNBC: Pre-Market Data and Bloomberg futures S&P 500 futures are up 10 and DOW futures are up 52 (fair value).
Oil prices were up over the last week with WTI futures at $83.19 per barrel and Brent at $86.81 per barrel. A year ago, WTI was at $95, and Brent was at $104 - so WTI oil prices are down about 12% year-over-year.
Here is a graph from Gasbuddy.com for nationwide gasoline prices. Nationally prices are at $3.82 per gallon. A year ago, prices were at $3.93 per gallon, so gasoline prices are down $0.11 per gallon year-over-year.
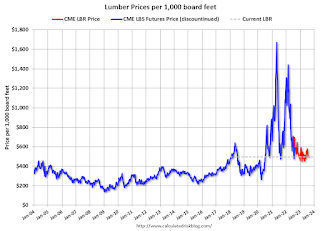
Update: Lumber Prices Down 29% YoY
by Calculated Risk on 8/13/2023 09:25:00 AM
Here is another monthly update on lumber prices.
Unfortunately, this impacts long term price comparisons since the new contract was priced about 24% higher than the old random length contract for the period both contracts were available.
This graph shows CME random length framing futures through last August (blue), and the new physically-delivered Lumber Futures (LBR) contract starting in August 2022 (Red).
 Click on graph for larger image.
We didn't see a significant runup in prices this Spring due to the housing slowdown.
This graph shows CME random length framing futures through last August (blue), and the new physically-delivered Lumber Futures (LBR) contract starting in August 2022 (Red).
LBR is currently at $496.00 per 1000 board feet, down 29% from $694.50 a year ago.
 Click on graph for larger image.
There is somewhat of a seasonal demand for lumber, and lumber prices usually peak in April or May.
We didn't see a significant runup in prices this Spring due to the housing slowdown.
Saturday, August 12, 2023
Real Estate Newsletter Articles this Week: The Long-Term Housing and Population Shift
by Calculated Risk on 8/12/2023 02:11:00 PM
At the Calculated Risk Real Estate Newsletter this week:
• The Long-Term Housing and Population Shift
• Part 1: Current State of the Housing Market; Overview for mid-August
• 1st Look at Local Housing Markets in July
• Black Knight Mortgage Monitor: Home Prices Increased Month-to-month to New Record High in June
• Atlanta Fed: Home Ownership Affordability Monitor
This is usually published 4 to 6 times a week and provides more in-depth analysis of the housing market.
You can subscribe at https://calculatedrisk.substack.com/
Most content is available for free (and no Ads), but please subscribe!
Schedule for Week of August 13, 2023
by Calculated Risk on 8/12/2023 08:11:00 AM
The key reports this week are July Retail Sales and Housing Starts.
For manufacturing, the Industrial Production report will be released.
No major economic releases scheduled.
 8:30 AM: Retail sales for July is scheduled to be released. The consensus is for 0.4% increase in retail sales.
This graph shows retail sales since 1992. This is monthly retail sales and food service, seasonally adjusted (total and ex-gasoline)
8:30 AM: The New York Fed Empire State manufacturing survey for August. The consensus is for a reading of -0.7, down from 1.1.
10:00 AM: The August NAHB homebuilder survey. The consensus is for a reading of 56, unchanged from 56. Any number above 50 indicates that more builders view sales conditions as good than poor.
7:00 AM ET: The Mortgage Bankers Association (MBA) will release the results for the mortgage purchase applications index.
 8:30 AM ET: Housing Starts for July.
 This graph shows single and multi-family housing starts since 1968.
The consensus is for 1.440 million SAAR, up from 1.434 million SAAR in June.
 9:15 AM: The Fed will release Industrial Production and Capacity Utilization for July.
This graph shows industrial production since 1967.
The consensus is for a 0.3% increase in Industrial Production, and for Capacity Utilization to increase to 79.2%.
2:00 PM: FOMC Minutes, Meeting of July 25-26, 2023
8:30 AM: The initial weekly unemployment claims report will be released. The consensus is for 256 thousand initial claims, up from 248 thousand last week.
8:30 AM: the Philly Fed manufacturing survey for August. The consensus is for a reading of -10.0, up from -13.5.
10:00 AM: State Employment and Unemployment (Monthly) for July 2023
Friday, August 11, 2023
Aug 11th COVID Update: New Pandemic Low for Deaths
by Calculated Risk on 8/11/2023 08:02:00 PM
 Note: Mortgage rates are from MortgageNewsDaily.com and are for top tier scenarios.
Due to changes at the CDC, weekly cases are no longer updated.
After the first few weeks, the pandemic low for weekly deaths had been the week of July 7, 2021, at 1,690 deaths (until recently).
Recently hospitalizations have been increasing from a low of 5,146.
The last few months have seen a positive trend.
| COVID Metrics | ||||
|---|---|---|---|---|
| Now | Week Ago | Goal | ||
| Hospitalized2🚩 | 6,829 | 6,151 | ≤3,0001 | |
| Deaths per Week2 | 437 | 473 | ≤3501 | |
| 1my goals to stop weekly posts, 2Weekly for Currently Hospitalized, and Deaths 🚩 Increasing number weekly for Hospitalized and Deaths ✅ Goal met. | ||||
 Click on graph for larger image.
This graph shows the weekly (columns) number of deaths reported.
For deaths, I'm currently using 3 weeks ago for "now", since the most recent two weeks will be revised significantly.
Realtor.com Reports Weekly Active Inventory Down 9% YoY; New Listings Down 14% YoY
by Calculated Risk on 8/11/2023 01:58:00 PM
Realtor.com has monthly and weekly data on the existing home market. Here is their weekly report from Danielle Hale: Weekly Housing Trends View — Data Week Ending Aug 5, 2023
• Active inventory declined, with for-sale homes lagging behind year ago levels by 9%.. This week marks a 7th consecutive decline in the number of homes actively for sale compared to the prior year, and the gap is growing.
• New listings–a measure of sellers putting homes up for sale–were down again this week, by 14% from one year ago. For 57 weeks, there have been fewer newly listed homes compared to the same time one year ago. The gap is starting to shrink as we get into a comparison against low new listings in the second half of 2022. This week’s data shows a 2.5 percentage point improvement over last week as the market slowly trends in a buyer-friendly direction, reflecting a stabilization of the low new listings count.
 Here is a graph of the year-over-year change in inventory according to realtor.com.
 Inventory was down 9.1% year-over-year - this was the seventh consecutive week with a YoY decrease following 58 consecutive weeks with a YoY increase in inventory.
Inventory is still up from the record lows in the 2nd half of 2021 and early 2022, and it is unlikely we will see new record lows by this measure this year.
Early Q3 GDP Tracking: Wide Range
by Calculated Risk on 8/11/2023 12:58:00 PM
As usual, there is a wide range of estimates early in the quarter. GDPNow's estimate is probably way too high.
From BofA:
Next week, we will initiate our 3Q US GDP tracker with the July retail sales data.From Goldman:
emphasis added
We left our Q3 GDP tracking estimate unchanged at +1.5% (qoq ar) [Aug 8th estimate]And from the Altanta Fed: GDPNow
The GDPNow model estimate for real GDP growth (seasonally adjusted annual rate) in the third quarter of 2023 is 4.1 percent on August 8, up from 3.9 percent on August 1. [Aug 8 estimate]
Part 1: Current State of the Housing Market; Overview for mid-August
by Calculated Risk on 8/11/2023 10:33:00 AM
Today, in the Calculated Risk Real Estate Newsletter: Part 1: Current State of the Housing Market; Overview for mid-August
A brief excerpt:
Interestingly, new home inventory is close to a record percentage of total inventory. This graph uses Not Seasonally Adjusted (NSA) existing home inventory from the National Association of Realtors® (NAR) and new home inventory from the Census Bureau (only completed and under construction inventory).There is much more in the article. You can subscribe at https://calculatedrisk.substack.com/
Note: Mark Fleming, Chief Economist at First American pointed this out in March.
It took a number of years following the housing bust for new home inventory to return to the pre-bubble percent of total inventory. Then, with the pandemic, existing home inventory collapsed and now the percent of new homes is close to 24% of total for sale inventory. The lack of existing home inventory, and few distressed sales, has been a positive for homebuilders.

Hotels: Occupancy Rate Down 1.0% Year-over-year
by Calculated Risk on 8/11/2023 08:15:00 AM
U.S. hotel performance declined from the previous week and showed lower comparisons year over year, according to CoStar’s latest data through 5 August. ...The following graph shows the seasonal pattern for the hotel occupancy rate using the four-week average.
30 July – 5 August 2023 (percentage change from comparable week in 2022):
• Occupancy: 68.9% (-1.0%)
• Average daily rate (ADR): US$158.10 (+2.2%)
• Revenue per available room (RevPAR): US$108.97 (+1.2%)
emphasis added
 Click on graph for larger image.
The red line is for 2023, black is 2020, blue is the median, and dashed light blue is for 2022. Dashed purple is for 2018, the record year for hotel occupancy.
The 4-week average of the occupancy rate is below the median rate for the period 2000 through 2022 (Blue).
Note: Y-axis doesn't start at zero to better show the seasonal change.
The 4-week average of the occupancy rate is probably at or near a peak for the year.


