by Calculated Risk on 8/15/2023 10:05:00 AM
Tuesday, August 15, 2023
NAHB: Builder Confidence Decreased in August "on Rising Mortgage Rates"
The National Association of Home Builders (NAHB) reported the housing market index (HMI) was at 50, down from 56 last month. Any number above 50 indicates that more builders view sales conditions as good than poor.
From the NAHB: Builder Confidence Falls on Rising Mortgage Rates
After steadily rising for seven consecutive months, builder confidence retreated in August as rising mortgage rates nearing 7% (per Freddie Mac) and stubbornly high shelter inflation have further eroded housing affordability and put a damper on consumer demand.
Builder confidence in the market for newly built single-family homes in August fell six points to 50, according to the National Association of Home Builders (NAHB)/Wells Fargo Housing Market Index (HMI) released today.
“Rising mortgage rates and high construction costs stemming from a dearth of construction workers, a lack of buildable lots and ongoing shortages of distribution transformers put a chill on builder sentiment in August,” said NAHB Chairman Alicia Huey, a custom home builder and developer from Birmingham, Ala. “But while this latest confidence reading is a reminder that housing affordability is an ongoing challenge, demand for new construction continues to be supported by a lack of resale inventory, as many home owners elect to stay put because they are locked in at a low mortgage rate.”
...
The August HMI survey also revealed that rising mortgage rates are causing more builders to use sales incentives to attract home buyers. After dropping steadily for four months (from 31% in March to 22% in July), the share of builders cutting prices to bolster sales rose again to 25% in August. The average decline for builders reducing prices remained at 6%. And the share of builders using incentives to bolster sales was 55% in August, higher than in July (52%) but still lower than in December 2022 (62%).
Derived from a monthly survey that NAHB has been conducting for more than 35 years, the NAHB/Wells Fargo HMI gauges builder perceptions of current single-family home sales and sales expectations for the next six months as “good,” “fair” or “poor.” The survey also asks builders to rate traffic of prospective buyers as “high to very high,” “average” or “low to very low.” Scores for each component are then used to calculate a seasonally adjusted index where any number over 50 indicates that more builders view conditions as good than poor.
All three major HMI indices posted declines in August. The HMI index gauging current sales conditions fell five points to 57, the component charting sales expectations in the next six months declined four points to 55 and the gauge measuring traffic of prospective buyers dropped six points to 34.
Looking at the three-month moving averages for regional HMI scores, the Northeast increased four points to 56, the Midwest and South were both unchanged at 45 and 58, respectively, and the West edged down a single point to 50.
emphasis added
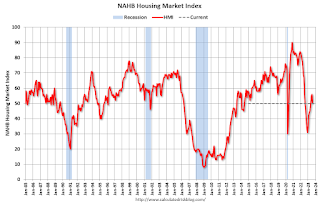 Click on graph for larger image.
This graph shows the NAHB index since Jan 1985.
This was below the consensus forecast.
Retail Sales Increased 0.7% in July
by Calculated Risk on 8/15/2023 08:37:00 AM
On a monthly basis, retail sales were up 0.7% from June to July (seasonally adjusted), and sales were up 3.2 percent from June 2022.
From the Census Bureau report:
Advance estimates of U.S. retail and food services sales for July 2023, adjusted for seasonal variation and holiday and trading-day differences, but not for price changes, were $696.4 billion, up 0.7 percent from the previous month, and up 3.2 percent above July 2022. ... The May 2023 to June 2023 percent change was revised from up 0.2 percent to up 0.3 percent.
emphasis added
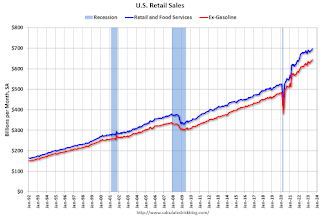 Click on graph for larger image.
This graph shows retail sales since 1992. This is monthly retail sales and food service, seasonally adjusted (total and ex-gasoline).
Retail sales ex-gasoline were up 0.8% in July.
The second graph shows the year-over-year change in retail sales and food service (ex-gasoline) since 1993.
Retail and Food service sales, ex-gasoline, increased by 5.6% on a YoY basis.
 The increase in sales in July was well above expectations, and sales in May and June were revised up.
Monday, August 14, 2023
Tuesday: Retail Sales, NY Fed Mfg, Homebuilder Survey
by Calculated Risk on 8/14/2023 09:02:00 PM
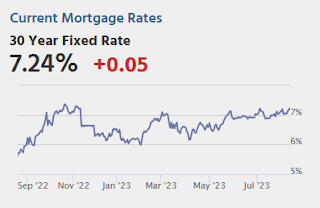
As of today, it's official. The average lender is quoting top tier 30yr fixed scenarios at the highest rates since November 7th. [30 year fixed 7.24%]Tuesday:
emphasis added
• At 8:30 AM ET, Retail sales for July is scheduled to be released. The consensus is for 0.4% increase in retail sales.
• Also at 8:30 AM, The New York Fed Empire State manufacturing survey for August. The consensus is for a reading of -0.7, down from 1.1.
• At 10:00 AM, The August NAHB homebuilder survey. The consensus is for a reading of 56, unchanged from 56. Any number above 50 indicates that more builders view sales conditions as good than poor.
Part 2: Current State of the Housing Market; Overview for mid-August
by Calculated Risk on 8/14/2023 03:52:00 PM
Today, in the Calculated Risk Real Estate Newsletter: Part 2: Current State of the Housing Market; Overview for mid-August
A brief excerpt:
On Friday, in Part 1: Current State of the Housing Market; Overview for mid-August I reviewed home inventory and sales.There is much more in the article. You can subscribe at https://calculatedrisk.substack.com/
...
Most measures of house prices have shown an increase in prices over the last several months, and a key question is Will house prices decline further later this year?
Other measures of house prices suggest prices will be up YoY soon in the Case-Shiller index. The NAR reported median prices were down 0.9% YoY in June, smaller than the 3.0% YoY decline in May. Black Knight reported prices were up 0.8% YoY in June to new all-time highs, and Freddie Mac reported house prices were up 1.7% YoY in June, up from 0.8% in May.
Here is a comparison of year-over-year change in the FMHPI, median house prices from the NAR, and the Case-Shiller National index.
The FMHPI and the NAR median prices appear to be leading indicators for Case-Shiller. Based on recent monthly data, and the FMHPI, it seems likely the YoY change in the Case-Shiller index will turn positive this summer.
2nd Look at Local Housing Markets in July
by Calculated Risk on 8/14/2023 10:10:00 AM
Today, in the Calculated Risk Real Estate Newsletter: 2nd Look at Local Housing Markets in July
A brief excerpt:
This is the second look at local markets in July. I’m tracking a sample of about 40 local housing markets in the US. Some of the 40 markets are states, and some are metropolitan areas. I’ll update these tables throughout the month as additional data is released.There is much more in the article. You can subscribe at https://calculatedrisk.substack.com/
Closed sales in July were mostly for contracts signed in May and June. Since 30-year fixed mortgage rates were in the 6.4% range in May, and 6.7% in June, compared to the low-to-mid 5% range the previous year, closed sales were down year-over-year in July.
...
In July, sales in these markets were down 13.9%. In June, these same markets were down 15.9% YoY Not Seasonally Adjusted (NSA).
This is a smaller YoY decline NSA than in June for these markets. Note that there were the same number of selling days each year in July 2022 and July 2023.
A key factor in the smaller YoY decline was that sales were steadily declining last year due to higher mortgage rates. ...
This data suggests the July existing home sales report will show another significant YoY decline - and probably close to the June sales rate of 4.16 million (SAAR) - and the 23rd consecutive month with a YoY decline in sales.
Many more local markets to come!
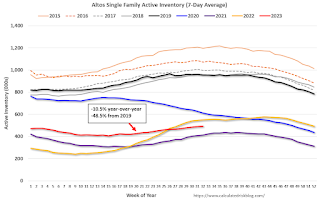
Housing August 14th Weekly Update: Inventory increased 0.9% Week-over-week; Down 10.5% Year-over-year
by Calculated Risk on 8/14/2023 08:11:00 AM
 Click on graph for larger image.
This inventory graph is courtesy of Altos Research.
Sunday, August 13, 2023
Sunday Night Futures
by Calculated Risk on 8/13/2023 06:12:00 PM
Weekend:
• Schedule for Week of August 13, 2023
Monday:
• No major economic releases scheduled.
From CNBC: Pre-Market Data and Bloomberg futures S&P 500 futures are up 10 and DOW futures are up 52 (fair value).
Oil prices were up over the last week with WTI futures at $83.19 per barrel and Brent at $86.81 per barrel. A year ago, WTI was at $95, and Brent was at $104 - so WTI oil prices are down about 12% year-over-year.
Here is a graph from Gasbuddy.com for nationwide gasoline prices. Nationally prices are at $3.82 per gallon. A year ago, prices were at $3.93 per gallon, so gasoline prices are down $0.11 per gallon year-over-year.
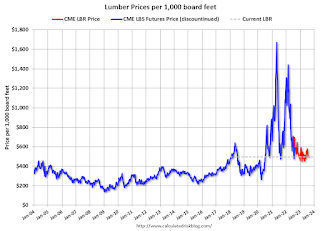
Update: Lumber Prices Down 29% YoY
by Calculated Risk on 8/13/2023 09:25:00 AM
This graph shows CME random length framing futures through last August (blue), and the new physically-delivered Lumber Futures (LBR) contract starting in August 2022 (Red).
Saturday, August 12, 2023
Real Estate Newsletter Articles this Week: The Long-Term Housing and Population Shift
by Calculated Risk on 8/12/2023 02:11:00 PM
At the Calculated Risk Real Estate Newsletter this week:
• The Long-Term Housing and Population Shift
• Part 1: Current State of the Housing Market; Overview for mid-August
• 1st Look at Local Housing Markets in July
• Black Knight Mortgage Monitor: Home Prices Increased Month-to-month to New Record High in June
• Atlanta Fed: Home Ownership Affordability Monitor
This is usually published 4 to 6 times a week and provides more in-depth analysis of the housing market.
You can subscribe at https://calculatedrisk.substack.com/
Most content is available for free (and no Ads), but please subscribe!
Schedule for Week of August 13, 2023
by Calculated Risk on 8/12/2023 08:11:00 AM
The key reports this week are July Retail Sales and Housing Starts.
For manufacturing, the Industrial Production report will be released.
No major economic releases scheduled.
 8:30 AM: Retail sales for July is scheduled to be released. The consensus is for 0.4% increase in retail sales.
This graph shows retail sales since 1992. This is monthly retail sales and food service, seasonally adjusted (total and ex-gasoline)
8:30 AM: The New York Fed Empire State manufacturing survey for August. The consensus is for a reading of -0.7, down from 1.1.
10:00 AM: The August NAHB homebuilder survey. The consensus is for a reading of 56, unchanged from 56. Any number above 50 indicates that more builders view sales conditions as good than poor.
7:00 AM ET: The Mortgage Bankers Association (MBA) will release the results for the mortgage purchase applications index.
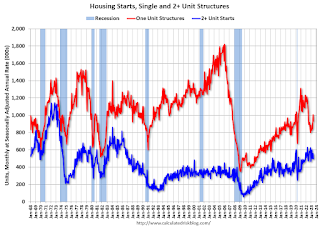 8:30 AM ET: Housing Starts for July.
 This graph shows single and multi-family housing starts since 1968.
The consensus is for 1.440 million SAAR, up from 1.434 million SAAR in June.
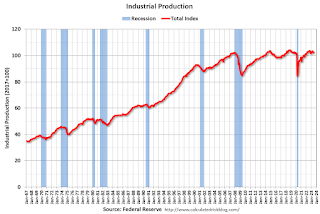 9:15 AM: The Fed will release Industrial Production and Capacity Utilization for July.
This graph shows industrial production since 1967.
The consensus is for a 0.3% increase in Industrial Production, and for Capacity Utilization to increase to 79.2%.
2:00 PM: FOMC Minutes, Meeting of July 25-26, 2023
8:30 AM: The initial weekly unemployment claims report will be released. The consensus is for 256 thousand initial claims, up from 248 thousand last week.
8:30 AM: the Philly Fed manufacturing survey for August. The consensus is for a reading of -10.0, up from -13.5.
10:00 AM: State Employment and Unemployment (Monthly) for July 2023

