by Calculated Risk on 8/17/2023 10:50:00 AM
Thursday, August 17, 2023
CoreLogic: US Home Investor Share Remained High in Early Summer 2023
Today, in the CalculatedRisk Real Estate Newsletter: CoreLogic: US Home Investor Share Remained High in Early Summer 2023
Excerpt:
Here are some excerpts from a CoreLogic report on investor buying: US Home Investor Share Remained High in Early Summer 2023There is much more in the post. You can subscribe at https://calculatedrisk.substack.com/The sizable U.S. home investor share seen over the past two years held steady going into the summer. In March 2023, investors accounted for 27% of all single-family home purchases; by June, that number was almost unchanged at 26%.Investors - by CoreLogic’s method - are still buying about a quarter of all homes in Q2 2023. Of course, the total number home bought by investors has declined somewhat.
Figure 2 illustrates the number of U.S. home purchases made by both investors and non-investors through March 2023. In April, May and June of 2023, home investors made 85,000, 98,000 and 82,000 purchases, respectively. Over the course of the second quarter, this was an annual decline of 90,000 purchases. However, when compared with the same months in 2019, the increase in home investor activity rose by more than 43,000. When comparing that number with non-investors, who made 392,000 fewer purchases in Q2 2023 than in Q2 2019, it becomes clear how different the current market than it was in the previous few years.
Weekly Initial Unemployment Claims Decrease to 239,000
by Calculated Risk on 8/17/2023 08:35:00 AM
The DOL reported:
In the week ending August 12, the advance figure for seasonally adjusted initial claims was 239,000, a decrease of 11,000 from the previous week's revised level. The previous week's level was revised up by 2,000 from 248,000 to 250,000. The 4-week moving average was 234,250, an increase of 2,750 from the previous week's revised average. The previous week's average was revised up by 500 from 231,000 to 231,500.The following graph shows the 4-week moving average of weekly claims since 1971.
emphasis added
 Click on graph for larger image.
The dashed line on the graph is the current 4-week average. The four-week average of weekly unemployment claims increased to 234,250.
The previous week was revised up.
Weekly claims were below the consensus forecast.
Wednesday, August 16, 2023
Thursday: Unemployment Claims, Philly Fed Mfg
by Calculated Risk on 8/16/2023 08:01:00 PM

Thursday:
• At 8:30 AM ET, The initial weekly unemployment claims report will be released. The consensus is for 256 thousand initial claims, up from 248 thousand last week.
• At 8:30 AM, the Philly Fed manufacturing survey for August. The consensus is for a reading of -10.0, up from -13.5.
FOMC Minutes: Staff No Longer Predicts Recession; "Upside Risks to Inflation"
by Calculated Risk on 8/16/2023 02:05:00 PM
From the Fed: Minutes of the Federal Open Market Committee, July 25-26, 2023. Excerpt:
The economic forecast prepared by the staff for the July FOMC meeting was stronger than the June projection. Since the emergence of stress in the banking sector in mid-March, indicators of spending and real activity had come in stronger than anticipated; as a result, the staff no longer judged that the economy would enter a mild recession toward the end of the year. However, the staff continued to expect that real GDP growth in 2024 and 2025 would run below their estimate of potential output growth, leading to a small increase in the unemployment rate relative to its current level.
The staff continued to project that total and core PCE price inflation would move lower in coming years. Much of the step-down in core inflation was expected to occur over the second half of 2023, with forward-looking indicators pointing to a slowing in the rate of increase of housing services prices and with core nonhousing services prices and core goods prices expected to decelerate over the remainder of 2023. Inflation was anticipated to ease further over 2024 as demand–supply imbalances continued to resolve; by 2025, total PCE price inflation was expected to be 2.2 percent, and core inflation was expected to be 2.3 percent.
The staff continued to judge that the risks to the baseline projection for real activity were tilted to the downside. Risks to the staff's baseline inflation forecast were seen as skewed to the upside, given the possibility that inflation dynamics would prove to be more persistent than expected or that further adverse shocks to supply conditions might occur. Moreover, the additional monetary policy tightening that would be necessitated by higher or more persistent inflation represented a downside risk to the projection for real activity.
...
Participants generally noted a high degree of uncertainty regarding the cumulative effects on the economy of past monetary policy tightening. Participants cited upside risks to inflation, including those associated with scenarios in which recent supply chain improvements and favorable commodity price trends did not continue or in which aggregate demand failed to slow by an amount sufficient to restore price stability over time, possibly leading to more persistent elevated inflation or an unanchoring of inflation expectations. In discussing downside risks to economic activity and inflation, participants considered the possibility that the cumulative tightening of monetary policy could lead to a sharper slowdown in the economy than expected, as well as the possibility that the effects of the tightening of bank credit conditions could prove more substantial than anticipated.
emphasis added
July Housing Starts: Record Number of Multi-Family Housing Units Under Construction
by Calculated Risk on 8/16/2023 09:35:00 AM
Today, in the CalculatedRisk Real Estate Newsletter: July Housing Starts: Record Number of Multi-Family Housing Units Under Construction
Excerpt:
The fourth graph shows housing starts under construction, Seasonally Adjusted (SA).There is much more in the post. You can subscribe at https://calculatedrisk.substack.com/
Red is single family units. Currently there are 678 thousand single family units (red) under construction (SA). This was down in July compared to June, and 153 thousand below the recent peak in May 2022. Single family units under construction peaked over a year ago since single family starts declined sharply.
Blue is for 2+ units. Currently there are 1,003 thousand multi-family units under construction. This breaks the record set in July 1973 of multi-family units being built for the baby-boom generation. For multi-family, construction delays are a significant factor. The completion of these units should help with rent pressure.
Combined, there are 1.681 million units under construction, just 29 thousand below the all-time record of 1.710 million set in October 2022.
Industrial Production Increased 1.0% in July
by Calculated Risk on 8/16/2023 09:15:00 AM
From the Fed: Industrial Production and Capacity Utilization
In July, total industrial production increased 1.0 percent following declines in the previous two months. Manufacturing output rose 0.5 percent in July; the production of motor vehicles and parts jumped 5.2 percent, while factory output elsewhere edged up 0.1 percent. The index for mining moved up 0.5 percent, and the index for utilities climbed 5.4 percent as very high temperatures in July raised demand for cooling. At 102.9 percent of its 2017 average, total industrial production in July was 0.2 percent below its year-earlier level. Capacity utilization moved up to 79.3 percent in July, a rate that is 0.4 percentage point below its long-run (1972–2022) average.
emphasis added
 Click on graph for larger image.
This graph shows Capacity Utilization. This series is up from the record low set in April 2020, and above the level in February 2020 (pre-pandemic).
Capacity utilization at 79.3% is 0.4 percentage points below the average from 1972 to 2022. This was slightly above consensus expectations.
Note: y-axis doesn't start at zero to better show the change.
 The second graph shows industrial production since 1967.
Industrial production increased in July to 102.9. This is above the pre-pandemic level.
Industrial production was above consensus expectations, however the previous months were revised down, combined.
Housing Starts Increased to 1.452 million Annual Rate in July
by Calculated Risk on 8/16/2023 08:30:00 AM
From the Census Bureau: Permits, Starts and Completions
Housing Starts:
Privately‐owned housing starts in July were at a seasonally adjusted annual rate of 1,452,000. This is 3.9 percent above the revised June estimate of 1,398,000 and is 5.9 percent above the July 2022 rate of 1,371,000. Single‐family housing starts in July were at a rate of 983,000; this is 6.7 percent above the revised June figure of 921,000. The July rate for units in buildings with five units or more was 460,000.
Building Permits:
Privately‐owned housing units authorized by building permits in July were at a seasonally adjusted annual rate of 1,442,000. This is 0.1 percent above the revised June rate of 1,441,000, but is 13.0 percent below the July 2022 rate of 1,658,000. Single‐family authorizations in July were at a rate of 930,000; this is 0.6 percent above the revised June figure of 924,000. Authorizations of units in buildings with five units or more were at a rate of 464,000 in July.
emphasis added
 Click on graph for larger image.
The first graph shows single and multi-family housing starts since 2000.
Multi-family starts (blue, 2+ units) decreased in July compared to June. Multi-family starts were down 0.8% year-over-year in July.
Single-family starts (red) increased in July and were up 9.5% year-over-year.
 The second graph shows single and multi-family housing starts since 1968.
 This shows the huge collapse following the housing bubble, and then the eventual recovery - and the recent collapse in single-family starts.
Total housing starts in July were close to expectations, however, starts in May and June were revised down, combined.
I'll have more later …
MBA: Mortgage Applications Decreased in Weekly Survey
by Calculated Risk on 8/16/2023 07:00:00 AM
From the MBA: Mortgage Applications Decrease in Latest MBA Weekly Survey
Mortgage applications decreased 0.8 percent from one week earlier, according to data from the Mortgage Bankers Association’s (MBA) Weekly Mortgage Applications Survey for the week ending August 11, 2023.
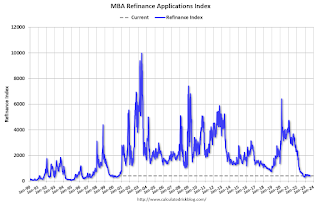
The Market Composite Index, a measure of mortgage loan application volume, decreased 0.8 percent on a seasonally adjusted basis from one week earlier. On an unadjusted basis, the Index decreased 2 percent compared with the previous week. The Refinance Index decreased 2 percent from the previous week and was 35 percent lower than the same week one year ago. The seasonally adjusted Purchase Index decreased 0 percent from one week earlier. The unadjusted Purchase Index decreased 2 percent compared with the previous week and was 26 percent lower than the same week one year ago.
“Treasury rates were elevated again last week following mixed data on inflation and more indication of resiliency in the economy, which may pose a challenge to the Federal Reserve’s efforts to lower inflation. The 30-year fixed mortgage rate increased for the third straight week, reaching 7.16 percent, matching October 2022’s rate and the highest rate since 2001,” said Joel Kan, MBA’s Vice President and Deputy Chief Economist. “Overall applications decreased because of these higher rates, as both purchase and refinance applications ended the week at their lowest levels since February 2023. Government purchase applications provided a bright spot, increasing 2.4 percent over the week, driven by increases in both FHA and VA purchase categories. The ARM share of applications rose slightly to 7 percent, the highest since April 2023, as borrowers look for relief from higher fixed rates.”
...
The average contract interest rate for 30-year fixed-rate mortgages with conforming loan balances ($726,200 or less) increased to 7.16 percent from 7.09 percent, with points decreasing to 0.68 from 0.70 (including the origination fee) for 80 percent loan-to-value ratio (LTV) loans.
emphasis added
 Click on graph for larger image.
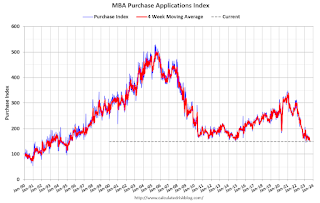
The first graph shows the MBA mortgage purchase index.
According to the MBA, purchase activity is down 26% year-over-year unadjusted.

Tuesday, August 15, 2023
Wednesday: Housing Starts, Industrial Production, FOMC Minutes
by Calculated Risk on 8/15/2023 08:21:00 PM

Wednesday:
• At 7:00 AM ET, The Mortgage Bankers Association (MBA) will release the results for the mortgage purchase applications index.
• At 8:30 AM, Housing Starts for July. The consensus is for 1.440 million SAAR, up from 1.434 million SAAR in June.
• At 9:15 AM, The Fed will release Industrial Production and Capacity Utilization for July. The consensus is for a 0.3% increase in Industrial Production, and for Capacity Utilization to increase to 79.2%.
• At 2:00 PM, FOMC Minutes, Meeting of July 25-26, 2023
The "New Normal" Mortgage Rate Range
by Calculated Risk on 8/15/2023 03:15:00 PM
Today, in the Calculated Risk Real Estate Newsletter: The "New Normal" Mortgage Rate Range
A brief excerpt:
In early June, I wrote: Could 6% to 7% 30-Year Mortgage Rates be the "New Normal"? This is an update to that post with some additional research.There is much more in the article. You can subscribe at https://calculatedrisk.substack.com/
In the previous post I noted that a key pitch, by real estate agents for home buyers right now, is that they will likely be able to refinance at a lower mortgage rate in a few years. The argument is that once the Federal Reserve has inflation back down to the 2% target, 30-mortgage rates will decline, perhaps to around 5% or lower. Of course, no one expects to see 3% mortgage rates without another crisis.
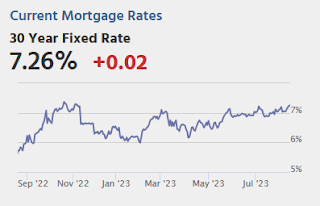
This graph is from Mortgage News Daily and shows the 30-year mortgage rate since 2010. Rates were mostly in the 3.5% to 5% range for over a decade prior to the pandemic. Currently rates are at 7.26% for 30-year mortgage rates.


