by Calculated Risk on 8/18/2023 08:01:00 PM
Friday, August 18, 2023
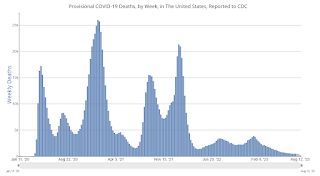
Aug 18th COVID Update: New Pandemic Low for Deaths

| COVID Metrics | ||||
|---|---|---|---|---|
| Now | Week Ago | Goal | ||
| Hospitalized2🚩 | 8,011 | 6,858 | ≤3,0001 | |
| Deaths per Week2 | 457 | 479 | ≤3501 | |
| 1my goals to stop weekly posts, 2Weekly for Currently Hospitalized, and Deaths 🚩 Increasing number weekly for Hospitalized and Deaths ✅ Goal met. | ||||
 Click on graph for larger image.
This graph shows the weekly (columns) number of deaths reported.
Lawler: Is The “Natural” Rate of Interest Back to Pre-Financial Crisis Levels?
by Calculated Risk on 8/18/2023 10:16:00 AM
Today, in the Calculated Risk Real Estate Newsletter: Lawler: Is The “Natural” Rate of Interest Back to Pre-Financial Crisis Levels?
A brief excerpt:
Here is a graph showing the HLW and LM estimates of r-star from 1990 through the first quarter of 2023.There is much more in the article. You can subscribe at https://calculatedrisk.substack.com/
Note that both of these estimates show a sharp decline in r-star right around the same time as the beginning of the financial crisis that led to the worst recession since the Great Depression. For folks who didn’t live through this period, it was a period of great fear, and there were serious concerns that the financial system might collapse. There were unprecedented actions taken by the government, but fear remained at elevated levels for years. These fears were not just limited to the US: in Europe multiple countries either faced banking crises, sovereign debt crises, or both and there were unprecedented actions taken by governments/central banks but fear remained for many years as well. And it was during those “fear years” that estimated levels of r-star remained at extremely low levels. Discrete changes like those observed were not related to longer-term trends such as demographics.
Note that in the last several years of last decade r-star estimates had begun to move gradually higher from the incredibly low levels (more so in the LM model than the HLW model) as fear began to recede, but then the pandemic hit, bringing more fear and uncertainty, though fortunately for a much shorter period than during the Great Recession/financial crisis/sovereign debt crisis.
Q3 GDP Tracking: Moving Up
by Calculated Risk on 8/18/2023 08:53:00 AM
From BofA:
Overall, the data flow since our last report pushed up our 3Q US GDP tracking estimate from the official forecast of 2.0% q/q saar (seasonally adjusted annual rate) to 2.7% q/q saar. [Aug 18th estimate]From Goldman:
emphasis added
July utilities output and auto production were stronger than our previous assumptions, and we boosted our Q3 GDP tracking estimate by 0.2pp to +2.4% (qoq ar). We also raised our domestic final sales growth forecast by five tenths to +2.6%. [Aug 16th estimate]And from the Altanta Fed: GDPNow
The GDPNow model estimate for real GDP growth (seasonally adjusted annual rate) in the third quarter of 2023 is 5.8 percent on August 16, up from 5.0 percent on August 15. After this morning's housing starts report from the US Census Bureau and industrial production report from the Federal Reserve Board of Governors, the nowcasts of third-quarter real personal consumption expenditures growth and third-quarter real gross private domestic investment growth increased from 4.4 percent and 8.8 percent, respectively, to 4.8 percent and 11.4 percent. [Aug 16 estimate]
Thursday, August 17, 2023
Lawler: Early Read on Existing Home Sales in July
by Calculated Risk on 8/17/2023 04:46:00 PM
Today, in the Calculated Risk Real Estate Newsletter: Lawler: Early Read on Existing Home Sales in July; 3rd Look at Local Housing Markets in July; California Sales Down 9% YoY
A brief excerpt:
From housing economist Tom Lawler:There is much more in the article. You can subscribe at https://calculatedrisk.substack.com/Based on publicly-available local realtor/MLS reports released across the country through today, I project that existing home sales as estimated by the National Association of Realtors ran at a seasonally adjusted annual rate of 4.06 million in July, down 1.0% from June’s preliminary pace and down 16.8% from last July’s seasonally adjusted pace.And a table of July sales.
Local realtor/MLS reports suggest that the median existing single-family home sales price last month was up by about 1.9% from last July.
In July, sales in these markets were down 14.2%. In June, these same markets were down 16.1% YoY Not Seasonally Adjusted (NSA).
This is a smaller YoY decline NSA than in June for these markets. Note that there were the same number of selling days each year in July 2022 and July 2023.
A key factor in the smaller YoY decline was that sales were steadily declining last year due to higher mortgage rates - and sales in July on a seasonally adjusted annual rate (SAAR) basis will likely be close to 4.06 million.
More local markets to come!
Hotels: Occupancy Rate Unchanged Year-over-year
by Calculated Risk on 8/17/2023 04:25:00 PM
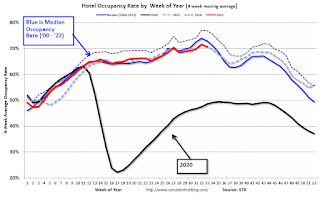
U.S. hotel performance declined from the previous week but showed mostly positive comparisons year over year, according to CoStar’s latest data through 12 August. ...The following graph shows the seasonal pattern for the hotel occupancy rate using the four-week average.
6-12 August 2023 (percentage change from comparable week in 2022):
• Occupancy: 68.3% (flat)
• Average daily rate (ADR): US$156.47 (+2.0%)
• Revenue per available room (RevPAR): US$106.89 (+2.0%)
emphasis added
 Click on graph for larger image.
The red line is for 2023, black is 2020, blue is the median, and dashed light blue is for 2022. Dashed purple is for 2018, the record year for hotel occupancy.
Realtor.com Reports Weekly Active Inventory Down 8% YoY; New Listings Down 8% YoY
by Calculated Risk on 8/17/2023 01:37:00 PM
Realtor.com has monthly and weekly data on the existing home market. Here is their weekly report from Sabrina Speianu: Weekly Housing Trends View — Data Week Ending Aug 12, 2023
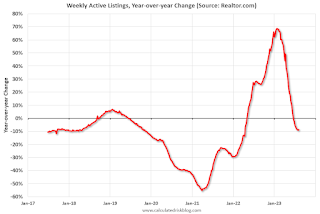
• Active inventory declined, with for-sale homes lagging behind year ago levels by 8.6%.
This past week marked the 8th consecutive decline in the number of homes actively for sale compared to the prior year, however the gap narrowed slightly compared to the previous week’s -9.1% figure. The existing home sales pace has been roughly consistent at a low level in recent months, suggesting home shoppers are looking. But the continued drag from existing homeowners choosing to stay put is holding back overall inventory. We expect a dip of 5% for 2023 overall compared to 2022.
• New listings–a measure of sellers putting homes up for sale–were down again this week, by 8.1% from one year ago.
For 58 weeks, there have been fewer newly listed homes compared to the same time one year ago. However, this gap has been shrinking as we start to compare against low new listings in the latter months of 2022. This week’s data shows a 5.9 percentage point improvement over last week as the market slowly trends in a more buyer-friendly direction. While it’s likely that we might see more new listings this fall than the previous year, inventory will continue to remain constrained as listings are still more than 20% below typical pre-pandemic levels seen this time of year.
 Here is a graph of the year-over-year change in inventory according to realtor.com.
 Inventory was down 8.6% year-over-year - this was the eighth consecutive week with a YoY decrease following 58 consecutive weeks with a YoY increase in inventory.
CoreLogic: US Home Investor Share Remained High in Early Summer 2023
by Calculated Risk on 8/17/2023 10:50:00 AM
Today, in the CalculatedRisk Real Estate Newsletter: CoreLogic: US Home Investor Share Remained High in Early Summer 2023
Excerpt:
Here are some excerpts from a CoreLogic report on investor buying: US Home Investor Share Remained High in Early Summer 2023There is much more in the post. You can subscribe at https://calculatedrisk.substack.com/The sizable U.S. home investor share seen over the past two years held steady going into the summer. In March 2023, investors accounted for 27% of all single-family home purchases; by June, that number was almost unchanged at 26%.Investors - by CoreLogic’s method - are still buying about a quarter of all homes in Q2 2023. Of course, the total number home bought by investors has declined somewhat.
Figure 2 illustrates the number of U.S. home purchases made by both investors and non-investors through March 2023. In April, May and June of 2023, home investors made 85,000, 98,000 and 82,000 purchases, respectively. Over the course of the second quarter, this was an annual decline of 90,000 purchases. However, when compared with the same months in 2019, the increase in home investor activity rose by more than 43,000. When comparing that number with non-investors, who made 392,000 fewer purchases in Q2 2023 than in Q2 2019, it becomes clear how different the current market than it was in the previous few years.
Weekly Initial Unemployment Claims Decrease to 239,000
by Calculated Risk on 8/17/2023 08:35:00 AM
The DOL reported:
In the week ending August 12, the advance figure for seasonally adjusted initial claims was 239,000, a decrease of 11,000 from the previous week's revised level. The previous week's level was revised up by 2,000 from 248,000 to 250,000. The 4-week moving average was 234,250, an increase of 2,750 from the previous week's revised average. The previous week's average was revised up by 500 from 231,000 to 231,500.The following graph shows the 4-week moving average of weekly claims since 1971.
emphasis added
 Click on graph for larger image.
The dashed line on the graph is the current 4-week average. The four-week average of weekly unemployment claims increased to 234,250.
The previous week was revised up.
Weekly claims were below the consensus forecast.
Wednesday, August 16, 2023
Thursday: Unemployment Claims, Philly Fed Mfg
by Calculated Risk on 8/16/2023 08:01:00 PM

Thursday:
• At 8:30 AM ET, The initial weekly unemployment claims report will be released. The consensus is for 256 thousand initial claims, up from 248 thousand last week.
• At 8:30 AM, the Philly Fed manufacturing survey for August. The consensus is for a reading of -10.0, up from -13.5.
FOMC Minutes: Staff No Longer Predicts Recession; "Upside Risks to Inflation"
by Calculated Risk on 8/16/2023 02:05:00 PM
From the Fed: Minutes of the Federal Open Market Committee, July 25-26, 2023. Excerpt:
The economic forecast prepared by the staff for the July FOMC meeting was stronger than the June projection. Since the emergence of stress in the banking sector in mid-March, indicators of spending and real activity had come in stronger than anticipated; as a result, the staff no longer judged that the economy would enter a mild recession toward the end of the year. However, the staff continued to expect that real GDP growth in 2024 and 2025 would run below their estimate of potential output growth, leading to a small increase in the unemployment rate relative to its current level.
The staff continued to project that total and core PCE price inflation would move lower in coming years. Much of the step-down in core inflation was expected to occur over the second half of 2023, with forward-looking indicators pointing to a slowing in the rate of increase of housing services prices and with core nonhousing services prices and core goods prices expected to decelerate over the remainder of 2023. Inflation was anticipated to ease further over 2024 as demand–supply imbalances continued to resolve; by 2025, total PCE price inflation was expected to be 2.2 percent, and core inflation was expected to be 2.3 percent.
The staff continued to judge that the risks to the baseline projection for real activity were tilted to the downside. Risks to the staff's baseline inflation forecast were seen as skewed to the upside, given the possibility that inflation dynamics would prove to be more persistent than expected or that further adverse shocks to supply conditions might occur. Moreover, the additional monetary policy tightening that would be necessitated by higher or more persistent inflation represented a downside risk to the projection for real activity.
...
Participants generally noted a high degree of uncertainty regarding the cumulative effects on the economy of past monetary policy tightening. Participants cited upside risks to inflation, including those associated with scenarios in which recent supply chain improvements and favorable commodity price trends did not continue or in which aggregate demand failed to slow by an amount sufficient to restore price stability over time, possibly leading to more persistent elevated inflation or an unanchoring of inflation expectations. In discussing downside risks to economic activity and inflation, participants considered the possibility that the cumulative tightening of monetary policy could lead to a sharper slowdown in the economy than expected, as well as the possibility that the effects of the tightening of bank credit conditions could prove more substantial than anticipated.
emphasis added
Last 10 Posts
In Memoriam: Doris "Tanta" Dungey
Archive
Econbrowser
Pettis: China Financial Markets
NY Times Upshot
The Big Picture
| Privacy Policy |
| Copyright © 2007 - 2025 CR4RE LLC |
| Excerpts NOT allowed on x.com |


