 RSS Feed
 by Calculated Risk on 8/21/2023 08:17:00 PM
Monday, August 21, 2023
Tuesday: Existing Home Sales, Richmond Fed Mfg
 From Matthew Graham at Mortgage News Daily: Another Day in The New, Higher Rate Reality
"Higher for longer," they said. And they weren't kidding. ... There have been some complicating factors over the past 2 weeks, but rising rate momentum is still mostly about the economy. As such, it's the economy that will need to demonstrate a shift before we see meaningful relief. Until then, the path of least resistance is the path we've been seeing. Today was just another day on that path. [30 year fixed 7.48%]Tuesday:
emphasis added
• At 10:00 AM ET, Existing Home Sales for July from the National Association of Realtors (NAR). The consensus is for 4.15 million SAAR, down from 4.16 million last month.
• Also at 10:00 AM, Richmond Fed Survey of Manufacturing Activity for August.
MBA Survey: "Share of Mortgage Loans in Forbearance Decreases to 0.39% in July"
by Calculated Risk on 8/21/2023 04:14:00 PM
From the MBA: Share of Mortgage Loans in Forbearance Decreases to 0.39% in July
The Mortgage Bankers Association’s (MBA) monthly Loan Monitoring Survey revealed that the total number of loans now in forbearance decreased by 5 basis points from 0.44% of servicers’ portfolio volume in the prior month to 0.39% as of July 31, 2023. According to MBA’s estimate, 195,000 homeowners are in forbearance plans. Mortgage servicers have provided forbearance to approximately 7.9 million borrowers since March 2020.
In July 2023, the share of Fannie Mae and Freddie Mac loans in forbearance decreased 1 basis point to 0.20%. Ginnie Mae loans in forbearance decreased 13 basis points to 0.80%, and the forbearance share for portfolio loans and private-label securities (PLS) decreased 7 basis points to 0.45%.
“The prevalence of forbearance plans has dramatically dropped since 2020, and the reasons that borrowers are in forbearance are changing,” said Marina Walsh, CMB, MBA’s Vice President of Industry Analysis. “About two-thirds of borrowers are still in forbearance because of the effects of COVID-19, but a growing share of borrowers are in forbearance for other reasons that cause temporary hardship such as financial distress or natural disasters. With the COVID-19 national emergency lifted, Fannie Mae and Freddie Mac recently announced the retirement of certain COVID-19 flexibilities relating to forbearance plans and workouts.[1]”
emphasis added
 Click on graph for larger image.
This graph shows the percent of portfolio in forbearance by investor type over time.
The share of forbearance plans has been decreasing and declined to 0.39% in July from 0.44% in June.
At the end of July, there were about 195,000 homeowners in forbearance plans.
4th Look at Local Housing Markets in July
by Calculated Risk on 8/21/2023 02:40:00 PM
Today, in the Calculated Risk Real Estate Newsletter: 4th Look at Local Housing Markets in July
A brief excerpt:
Note: The National Association of Realtors (NAR) is scheduled to release July existing home sales tomorrow, Tuesday, August 22nd, at 10:00 AM ET. The consensus is for 4.15 million SAAR, down from 4.16 million last month. Housing economist Tom Lawler expects the NAR to report sales of 4.06 million SAAR for July.There is much more in the article. You can subscribe at https://calculatedrisk.substack.com/
...
In July, sales in these markets were down 15.0%. In June, these same markets were down 16.8% YoY Not Seasonally Adjusted (NSA).
This is a smaller YoY decline NSA than in June for these markets. Note that there were the same number of selling days each year in July 2022 and July 2023.
A key factor in the smaller YoY decline was that sales were steadily declining last year due to higher mortgage rates - and sales in July on a seasonally adjusted annual rate (SAAR) basis will likely be close to 4.06 million.
Several local markets - like Illinois, Miami, New Jersey and New York - will report after the NAR release.

DOT: Vehicle Miles Driven Increased 2.8% year-over-year in June
by Calculated Risk on 8/21/2023 11:12:00 AM
This is something I check occasionally.
The Department of Transportation (DOT) reported:
Travel on all roads and streets changed by +3.1% (+8.4 billion vehicle miles) for June 2023 as compared with June 2022. Travel for the month is estimated to be 283.0 billion vehicle miles.
The seasonally adjusted vehicle miles traveled for June 2023 is 268.9 billion miles, a 2.8% (7.4 billion vehicle miles) change over June 2022. It also represents a -0.2% change (-0.4 billion vehicle miles) compared with May 2023.
emphasis added
 Click on graph for larger image.
This graph shows the monthly total vehicle miles driven, seasonally adjusted.
Miles driven declined sharply in March 2020, and really collapsed in April 2020. Miles driven are now slightly below pre-pandemic levels.
Housing August 21st Weekly Update: Inventory increased 0.9% Week-over-week; Down 10.0% Year-over-year
by Calculated Risk on 8/21/2023 08:21:00 AM
Altos reports that active single-family inventory was up 0.9% week-over-week.
 Click on graph for larger image.
This inventory graph is courtesy of Altos Research.
As of August 18th, inventory was at 497 thousand (7-day average), compared to 492 thousand the prior week.
Year-to-date, inventory is up 1.2%. And inventory is up 22.5% from the seasonal bottom 18 weeks ago.
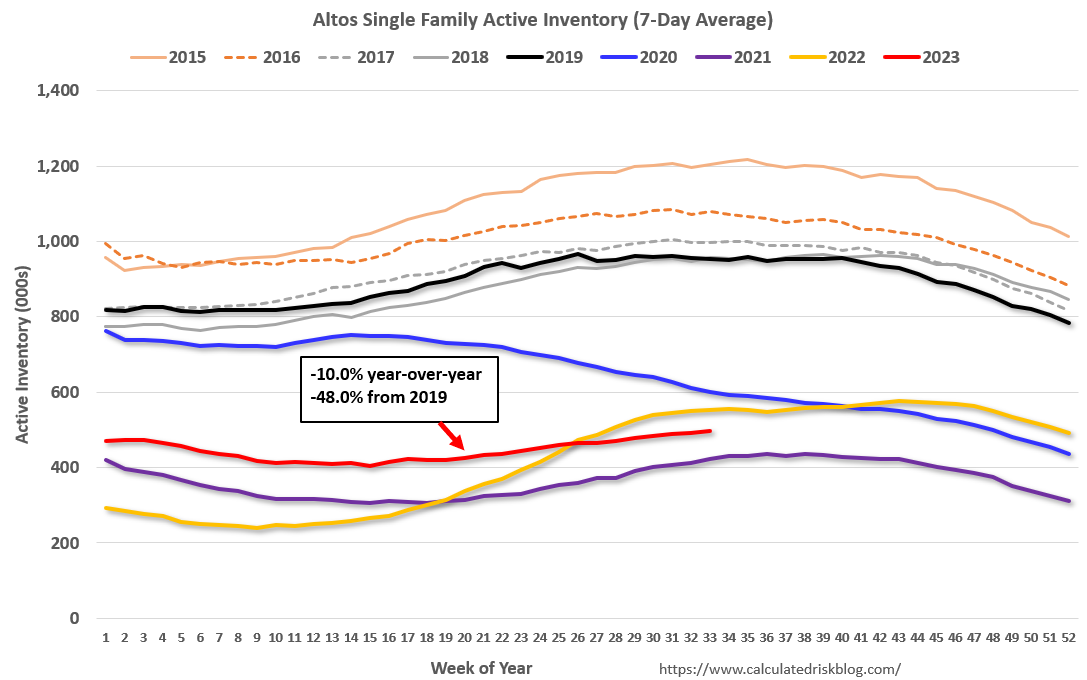
The red line is for 2023. The black line is for 2019. Note that inventory is up from the record low for the same week in 2021, but below last year and still well below normal levels.
Inventory was down 10.0% compared to the same week in 2022 (last week it was down 10.5%), and down 48.0% compared to the same week in 2019 (last week down 48.5%).
It appears same week inventory will be below 2022 levels for the remainder of the year. It is possible that inventory will fall below the record lows in 2021 and early 2022 later this year or in early 2024, but currently that seems unlikely.
Mike Simonsen discusses this data regularly on Youtube.
Sunday, August 20, 2023
Sunday Night Futures
by Calculated Risk on 8/20/2023 06:27:00 PM
Weekend:
• Schedule for Week of August 20, 2023
Monday:
• No major economic releases scheduled.
From CNBC: Pre-Market Data and Bloomberg futures S&P 500 futures are up 3 and DOW futures are up 15 (fair value).
Oil prices were down over the last week with WTI futures at $81.25 per barrel and Brent at $84.80 per barrel. A year ago, WTI was at $94, and Brent was at $96 - so WTI oil prices are down about 13% year-over-year.
Here is a graph from Gasbuddy.com for nationwide gasoline prices. Nationally prices are at $3.84 per gallon. A year ago, prices were at $3.83 per gallon, so gasoline prices are down $0.03 per gallon year-over-year.
Early Look at 2024 Cost-Of-Living Adjustments and Maximum Contribution Base
by Calculated Risk on 8/20/2023 08:17:00 AM
The BLS reported on August 10th:
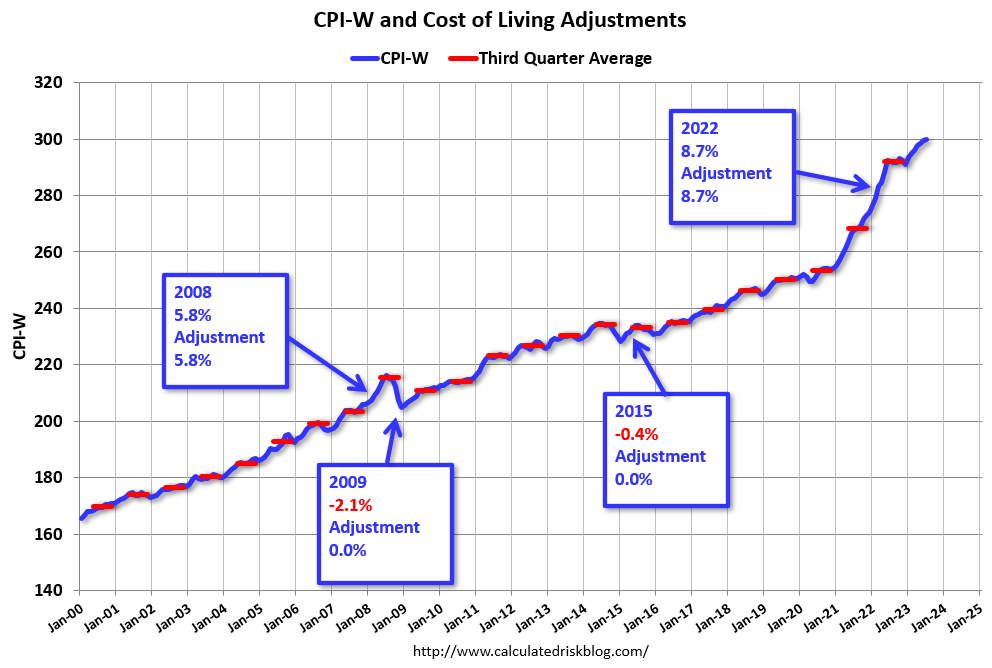
The Consumer Price Index for Urban Wage Earners and Clerical Workers (CPI-W) increased 2.6 percent over the last 12 months to an index level of 299.899 (1982-84=100). For the month, the index increased 0.2 percent prior to seasonal adjustment.CPI-W is the index that is used to calculate the Cost-Of-Living Adjustments (COLA). The calculation dates have changed over time (see Cost-of-Living Adjustments), but the current calculation uses the average CPI-W for the three months in Q3 (July, August, September) and compares to the average for the highest previous average of Q3 months. Note: this is not the headline CPI-U and is not seasonally adjusted (NSA).
• In 2022, the Q3 average of CPI-W was 291.901.
The 2022 Q3 average was the highest Q3 average, so we only have to compare Q3 this year to last year.
 Click on graph for larger image.
This graph shows CPI-W since January 2000. The red lines are the Q3 average of CPI-W for each year.
Note: The year labeled is for the calculation, and the adjustment is effective for December of that year (received by beneficiaries in January of the following year).
CPI-W was up 2.6% year-over-year in July, and although this is early - we need the data for August and September - my early guess is COLA will probably be close to 3% this year, the smallest increase since 1.3% in 2021.
Note that CPI-W was slightly negative month-over-month in August of 2022, so it is likely there will be a larger year-over-year increase in CPI-W next month than in July, hence my 3% early guess.
Contribution and Benefit Base
The contribution base will be adjusted using the National Average Wage Index. This is based on a one-year lag. The National Average Wage Index is not available for 2022 yet, wages increased solidly in 2022. If wages increased 5% in 2022, then the contribution base next year will increase to around $168,200 in 2024, from the current $160,200.
Remember - this is an early look. What matters is average CPI-W, NSA, for all three months in Q3 (July, August and September).
Saturday, August 19, 2023
Real Estate Newsletter Articles this Week: Record Number of Multi-Family Housing Units Under Construction
by Calculated Risk on 8/19/2023 02:11:00 PM
At the Calculated Risk Real Estate Newsletter this week:
• July Housing Starts: Record Number of Multi-Family Housing Units Under Construction
• The "New Normal" Mortgage Rate Range
• Part 2: Current State of the Housing Market; Overview for mid-August
• Lawler: Early Read on Existing Home Sales in July; 3rd Look at Local Housing Markets in July; California Sales Down 9% YoY
• Lawler: Is The “Natural” Rate of Interest Back to Pre-Financial Crisis Levels?
• CoreLogic: US Home Investor Share Remained High in Early Summer 2023
This is usually published 4 to 6 times a week and provides more in-depth analysis of the housing market.
You can subscribe at https://calculatedrisk.substack.com/
Most content is available for free (and no Ads), but please subscribe!
Schedule for Week of August 20, 2023
by Calculated Risk on 8/19/2023 08:11:00 AM
The key reports this week are July New and Existing Home sales.
For manufacturing, the August Richmond and Kansas City Fed surveys will be released.
Fed Chair Jerome Powell will speak on the "Economic Outlook" at the Jackson Hole Symposium on Friday.
The BLS will release the preliminary employment benchmark revision on Wednesday.
No major economic releases scheduled.
 10:00 AM: Existing Home Sales for July from the National Association of Realtors (NAR). The consensus is for 4.15 million SAAR, down from 4.16 million last month.
The graph shows existing home sales from 1994 through the report last month.
Housing economist Tom Lawler expects the NAR to report sales of 4.06 million SAAR for July.
10:00 AM: Richmond Fed Survey of Manufacturing Activity for August.
7:00 AM ET: The Mortgage Bankers Association (MBA) will release the results for the mortgage purchase applications index.
 10:00 AM: New Home Sales for July from the Census Bureau.
 This graph shows New Home Sales since 1963. The dashed line is the sales rate for last month.
The consensus is for 701 thousand SAAR, up from 697 thousand in June.
10:00 AM: the Bureau of Labor Statistics (BLS) will release the 2023 Preliminary Benchmark Revision to Establishment Survey Data.
During the day: The AIA's Architecture Billings Index for July (a leading indicator for commercial real estate).
8:30 AM: The initial weekly unemployment claims report will be released. The consensus is for 244 thousand initial claims, up from 239 thousand last week.
8:30 AM ET: Chicago Fed National Activity Index for July. This is a composite index of other data.
8:30 AM: Durable Goods Orders for July from the Census Bureau. The consensus is for a 4.0% decrease in durable goods orders.
11:00 AM: the Kansas City Fed manufacturing survey for August.
10:00 AM: University of Michigan's Consumer sentiment index (Final for August). The consensus is for a reading of 71.2.
10:05 AM: Speech, Fed Chair Jerome Powell, Economic Outlook, At the Jackson Hole Economic Policy Symposium
Friday, August 18, 2023
Aug 18th COVID Update: New Pandemic Low for Deaths
by Calculated Risk on 8/18/2023 08:01:00 PM
 Note: Mortgage rates are from MortgageNewsDaily.com and are for top tier scenarios.
Due to changes at the CDC, weekly cases are no longer updated.
After the first few weeks, the pandemic low for weekly deaths had been the week of July 7, 2021, at 1,690 deaths (until recently).
Recently hospitalizations have been increasing from a low of 5,146.
| COVID Metrics | ||||
|---|---|---|---|---|
| Now | Week Ago | Goal | ||
| Hospitalized2🚩 | 8,011 | 6,858 | ≤3,0001 | |
| Deaths per Week2 | 457 | 479 | ≤3501 | |
| 1my goals to stop weekly posts, 2Weekly for Currently Hospitalized, and Deaths 🚩 Increasing number weekly for Hospitalized and Deaths ✅ Goal met. | ||||
 Click on graph for larger image.
This graph shows the weekly (columns) number of deaths reported.
The last few months have seen a positive trend.
For deaths, I'm currently using 3 weeks ago for "now", since the most recent two weeks will be revised significantly.

In Memoriam: Doris "Tanta" Dungey


| Privacy Policy |
| Copyright © 2007 - 2025 CR4RE LLC |
| Excerpts NOT allowed on x.com |