 RSS Feed
 by Calculated Risk on 8/23/2023 02:53:00 PM
Wednesday, August 23, 2023
AIA: Architecture Billings "Stable" in July; Multi-family Billings Decline for 12th Consecutive Month
Note: This index is a leading indicator primarily for new Commercial Real Estate (CRE) investment.
From the AIA: AIA/Deltek Architecture Billings Index Sees Stable Business Conditions in July
The American Institute of Architects (AIA)/Deltek Architecture Billings Index (ABI) results for July signals mostly stable business conditions. The ABI score was 50.0, indicating that billings at architecture firms remained flat for the month.
“This is the third straight month that billings at architecture firms have stabilized,” said AIA Chief Economist Kermit Baker, PhD. “New project work has been even stronger over this period. This suggests that design work may finally begin to increase over the coming months, although somewhat modestly.”
Firms with a commercial/industrial specialization reported their strongest billings growth in more than a year, while firms with a multifamily residential specialization continued to report declining billings. While this marks the ninth consecutive month of growth for firms located in the Midwest region, firms in other regions reported modest declines in billings.
...
• Regional averages: Midwest (51.6); West (49.6); Northeast (49.3); South (48.9)
• ector index breakdown: commercial/industrial (52.7); institutional (51.2); mixed practice (firms that do not have at least half of their billings in any one other category) (46.3); multifamily residential (45.4)
emphasis added
 Click on graph for larger image.
This graph shows the Architecture Billings Index since 1996. The index was at 50.0 in July, down from 50.1 in June. Anything above 50 indicates an increase in demand for architects' services.
Note: This includes commercial and industrial facilities like hotels and office buildings, multi-family residential, as well as schools, hospitals and other institutions.
This index usually leads CRE investment by 9 to 12 months, so this index suggests a slowdown in CRE investment later in 2023 and into 2024.
Note that multi-family billing turned down in August 2022 and has been negative for twelve consecutive months (with revisions). This suggests we will see a further downturn in multi-family starts this year.
New Home Sales increase to 714,000 Annual Rate in July; Median New Home Price is Down 12% from the Peak
by Calculated Risk on 8/23/2023 10:50:00 AM
Today, in the Calculated Risk Real Estate Newsletter: New Home Sales increase to 714,000 Annual Rate in July
Brief excerpt:
The Census Bureau reports New Home Sales in July were at a seasonally adjusted annual rate (SAAR) of 714 thousand. The previous three months were revised down, combined.You can subscribe at https://calculatedrisk.substack.com/.
...
The next graph shows new home sales for 2022 and 2023 by month (Seasonally Adjusted Annual Rate). Sales in July 2023 were up 31.5% from July 2022. Year-to-date sales are up 0.4% compared to the same period in 2022.
As expected, new home sales were up solidly year-over-year in July, and it is fairly certain there will be more sales in 2023 than in 2022 - although 7%+ mortgage rates will likely slow sales.

Employment: Preliminary annual benchmark revision shows downward adjustment of 306,000 jobs
by Calculated Risk on 8/23/2023 10:09:00 AM
The BLS released the preliminary annual benchmark revision showing 306,000 fewer payroll jobs as of March 2023. The final revision will be published when the January 2024 employment report is released in February 2024. The number is then "wedged back" to the previous revision (March 2022). Usually, the preliminary estimate is pretty close to the final benchmark estimate.
The annual revision is benchmarked to state tax records. From the BLS:
n accordance with usual practice, the Bureau of Labor Statistics (BLS) is announcing the preliminary estimate of the upcoming annual benchmark revision to the establishment survey employment series. The final benchmark revision will be issued in February 2024 with the publication of the January 2024 Employment Situation news release.Construction was revised up by 30,000 jobs, and manufacturing revised down by 43,000 jobs.
Each year, the Current Employment Statistics (CES) survey employment estimates are benchmarked to comprehensive counts of employment for the month of March. These counts are derived from state unemployment insurance (UI) tax records that nearly all employers are required to file. For National CES employment series, the annual benchmark revisions over the last 10 years have averaged plus or minus one-tenth of one percent of total nonfarm employment. The preliminary estimate of the benchmark revision indicates a downward adjustment to March 2023 total nonfarm employment of −306,000 (−0.2 percent).
emphasis added
This preliminary estimate showed 358,000 fewer private sector jobs, and 52,000 more government jobs (as of March 2023) than originally estimated.
New Home Sales increase to 714,000 Annual Rate in July
by Calculated Risk on 8/23/2023 10:00:00 AM
The Census Bureau reports New Home Sales in July were at a seasonally adjusted annual rate (SAAR) of 714 thousand.
The previous three months were revised down, combined.
Sales of new single‐family houses in July 2023 were at a seasonally adjusted annual rate of 714,000, according to estimates released jointly today by the U.S. Census Bureau and the Department of Housing and Urban Development. This is 4.4 percent above the revised June rate of 684,000 and is 31.5 percent above the July 2022 estimate of 543,000.
emphasis added
 Click on graph for larger image.
The first graph shows New Home Sales vs. recessions since 1963. The dashed line is the current sales rate.
New home sales are at pre-pandemic levels.
The second graph shows New Home Months of Supply.
 The months of supply decreased in July to 7.3 months from 7.5 months in June.
 The all-time record high was 12.2 months of supply in January 2009. The all-time record low was 3.3 months in August 2020.
This is above the top of the normal range (about 4 to 6 months of supply is normal).
"The seasonally‐adjusted estimate of new houses for sale at the end of July was 437,000. This represents a supply of 7.3 months at the current sales rate."Sales were above expectations of 701 thousand SAAR, however, sales for the three previous months were revised down, combined. I'll have more later today.
Black Knight: Mortgage Delinquency Rate Increased Slightly in July
by Calculated Risk on 8/23/2023 09:02:00 AM
From Black Knight: Black Knight’s First Look at July Mortgage Performance Data: Foreclosure Inventory Hits Lowest Level in 15 Months, While Serious Delinquencies Continue to Decline
• While the national delinquency rate edged up 9 basis points in July to 3.21%, it was down 12 basis points year over year and remains within 12 basis points of March’s record lowAccording to Black Knight's First Look report, the percent of loans delinquent increased 2.9% in July compared to June and decreased 3.6% year-over-year.
• Meanwhile, serious delinquencies (90+ days past due) continued to improve, falling to 468K – the lowest level seen since the pre-Great Financial Crisis housing market peak and down 161K (-26%) from July 2022
• 30-day delinquencies rose by 35K in the month, with 60-day DQs rising by 17K (6.4%) – while those 90+ days past due fell by 3K (-0.6%)
• Loans in active foreclosure fell to 220K – the fewest since just after the end of federal foreclosure moratoria – and remain down 63K (-22%) from February 2020, prior to the pandemic
• July’s 26.3K foreclosure starts were 4% below the average number of such actions over the preceding 12 months and remain 39% below pre-pandemic levels
• Foreclosure starts equated to 5.6% of 90+ day delinquencies – still more than three percentage points below pre-pandemic foreclosure referral rates – while July’s 6.1K foreclosure sales (completions) nationally were down 11% from June
• Prepayment activity fell under easing seasonal home buying pressure along with interest rates briefly rising above 7% and ending July at 6.88%, with prepayments still down 28% from July 2022
emphasis added
Black Knight reported the U.S. mortgage delinquency rate (loans 30 or more days past due, but not in foreclosure) was 3.21% in July, up from 3.12% the previous month.
The percent of loans in the foreclosure process decreased slightly in July to 0.42%, from 0.42% the previous month.
The number of delinquent properties, but not in foreclosure, is down 39,000 properties year-over-year, and the number of properties in the foreclosure process is down 4,000 properties year-over-year.
| Black Knight: Percent Loans Delinquent and in Foreclosure Process | ||||
|---|---|---|---|---|
| July 2023 | June 2023 | |||
| Delinquent | 3.21% | 3.12% | ||
| In Foreclosure | 0.42% | 0.42% | ||
| Number of properties: | ||||
| Number of properties that are delinquent, but not in foreclosure: | 1,700,000 | 1,650,000 | ||
| Number of properties in foreclosure pre-sale inventory: | 220,000 | 224,000 | ||
| Total Properties | 1,919,000 | 1,874,000 | ||
MBA: Mortgage Applications Decreased in Weekly Survey; Purchase Applications "lowest level since April 1995"
by Calculated Risk on 8/23/2023 07:00:00 AM
From the MBA: Mortgage Applications Decrease in Latest MBA Weekly Survey
Mortgage applications decreased 4.2 percent from one week earlier, according to data from the Mortgage Bankers Association’s (MBA) Weekly Mortgage Applications Survey for the week ending August 18, 2023.
The Market Composite Index, a measure of mortgage loan application volume, decreased 4.2 percent on a seasonally adjusted basis from one week earlier. On an unadjusted basis, the Index decreased 6 percent compared with the previous week. The Refinance Index decreased 3 percent from the previous week and was 35 percent lower than the same week one year ago. The seasonally adjusted Purchase Index decreased 5 percent from one week earlier. The unadjusted Purchase Index decreased 7 percent compared with the previous week and was 30 percent lower than the same week one year ago.
“Treasury yields continued to spike last week as markets grappled with illiquidity and concerns that the resilient economy will keep inflation stubbornly high. This spike pushed mortgage rates higher last week, with the 30-year fixed rate increasing to 7.31 percent – the highest level since December 2000,” said Joel Kan, MBA’s Vice President and Deputy Chief Economist. “Applications for home purchase mortgages dropped to their lowest level since April 1995, as homebuyers withdrew from the market due to the elevated rate environment and the erosion of purchasing power. Low housing supply is also keeping home prices high in many markets, adding to the affordability hurdles buyers are facing.”
Added Kan, “The ARM share of applications increased to 7.6 percent, the highest level in five months, and the number of ARM applications picked up by 4 percent last week. Some homebuyers are looking to lower their monthly payments by accepting some interest rate risk after the initial fixed period.”
...
The average contract interest rate for 30-year fixed-rate mortgages with conforming loan balances ($726,200 or less) increased to 7.31 percent from 7.16 percent, with points increasing to 0.78 from 0.68 (including the origination fee) for 80 percent loan-to-value ratio (LTV) loans. The effective rate increased from last week.
emphasis added
 Click on graph for larger image.
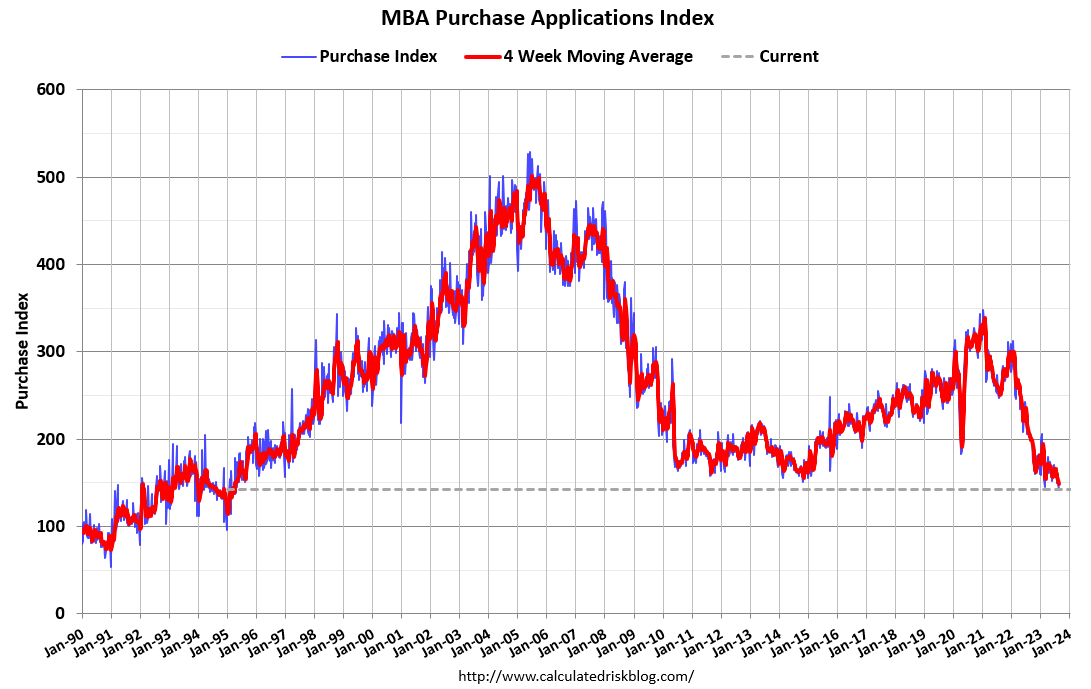
The first graph shows the MBA mortgage purchase index.
According to the MBA, purchase activity is down 30% year-over-year unadjusted.
Red is a four-week average (blue is weekly). This is the lowest level since 1995!

The second graph shows the refinance index since 1990.
With higher mortgage rates, the refinance index declined sharply in 2022 - and has mostly flat lined at a low level since then.
Tuesday, August 22, 2023
Wednesday: New Home Sales
by Calculated Risk on 8/22/2023 08:16:00 PM
 Note: Mortgage rates are from MortgageNewsDaily.com and are for top tier scenarios.
Wednesday:
• At 7:00 AM ET, The Mortgage Bankers Association (MBA) will release the results for the mortgage purchase applications index.
• At 10:00 AM, New Home Sales for July from the Census Bureau. The consensus is for 701 thousand SAAR, up from 697 thousand in June.
• Also at 10:00 AM, the Bureau of Labor Statistics (BLS) will release the 2023 Preliminary Benchmark Revision to Establishment Survey Data.
• During the day, The AIA's Architecture Billings Index for July (a leading indicator for commercial real estate).
Lawler: More on “R-Star”
by Calculated Risk on 8/22/2023 01:26:00 PM
Last week, housing economist Tom Lawler wrote: Is The “Natural” Rate of Interest Back to Pre-Financial Crisis Levels?. Here are some additional comments from Lawler:
While NY Fed President Williams recently argued that “there is no evidence that the era of low natural rates of interest has ended,” (which many including myself would say is not accurate), other analysts at the NY Fed who oversee its “Dynamic Stochastic General Equilibrium” (DSGE) model suggest otherwise, at least for the “short-run” measure of the natural rate of interest, or “r-star.” In a recent post on the Liberty Street Economics blog, economists Katie Baker, Logan Casey, Marco Del Negro, Aidan Gleich, and Ramya Nallamotu discuss some of the reasons why their DSGE’s estimate of the short-run natural rate of interest (in inflation-adjusted terms) increased from 0.81% in December 2022 to an eye-popping 3.57% in March 2023. (The post is available at The Evolution of Short-Run r* after the Pandemic) The latest results from the DSGE model project that r-star will decline to 2.22% at the end of 2023, 1.77% at the end of 2024, and 1.47% at the end of 2025.
Here is the last paragraph in the blog (my bold).
“In sum, to make sense of recent developments in the U.S. economy, we must explain the fact that the economy remains quite strong in spite of the FFR being more than 500 basis points higher than it was a little more than a year ago. The model rationalizes these developments by postulating that the short-run natural rate of interest has increased considerably over the past year. This, in turn, has implications for the speed of the decline of inflation toward the FOMC’s long run goal and for assessing the stance of monetary policy.”
Now I’m not a big fan of DSGE models, and I’m certainly not a big fan of the HLW model that was the basis for NY Fed Governor Williams’ assertion that there is no evidence that the natural rate of interest has increased meaningfully, if at all. There are, however, many reasons to believe that the natural rate of interest HAS in fact increased significantly, including but not limited to market-based signals.
Not surprisingly, of course, market participants are quite uncertain as to “the Fed’s” current view is on the “natural” rate of interest, as there is conflicting evidence not just within the NY FED but from research at other regional Federal Reserve Banks.
Some are hoping that the Fed Chairman Powell may address the “r-star issue” at Jackson Hole this week, or at least express his views on this issue, though given the conflicting evidence I’m not sure whether he will provide much clarity save that the level of r-star is “highly uncertain” – which is certainly the case!
But I think there is a strong case that the “natural” rate of interest is back to levels just prior to the 2008 financial crisis.
NAR: Existing-Home Sales Decreased to 4.07 million SAAR in July; Median Prices Increased 1.9% YoY in July
by Calculated Risk on 8/22/2023 10:56:00 AM
Today, in the CalculatedRisk Real Estate Newsletter: NAR: Existing-Home Sales Decreased to 4.07 million SAAR in July; Median Prices Increased 1.9% YoY in July
Excerpt:
On prices, the NAR reported:There is much more in the article. You can subscribe at https://calculatedrisk.substack.com/ Please subscribe!The median existing-home price for all housing types in July was $406,700, an increase of 1.9% from July 2022 ($399,000). Prices rose in the Northeast, Midwest and South but were unchanged in the West.Median prices are distorted by the mix (repeat sales indexes like Case-Shiller and FHFA are probably better for measuring prices).
The YoY change in the median price peaked at 25.2% in May 2021 and bottomed at down 3.0% in May 2023. Prices are now up 1.9% YoY. Median house prices decreased 0.8% from June to July and are down 1.7% from the peak in June 2022 (NSA).
The median price tends to lead the Case-Shiller index, and this is further evidence that Case-Shiller will likely turn positive year-over-year soon.
Note that closed sales in July were mostly for contracts signed in May and June. Mortgage rates, according to the Freddie Mac PMMS, averaged around 6.4% in May and 6.7% in June. August sales will be mostly for contracts signed in June and July, mortgage rates averaged 6.9% in July, so seasonally adjusted closed sales will likely be less in August compared to July.
The recent surge in mortgage rates over 7% will impact closed sales in September, and it now seems likely that in a few months existing home sales will fall below the previous cycle low of 4.00 million in January 2023.

NAR: Existing-Home Sales Decreased to 4.07 million SAAR in July
by Calculated Risk on 8/22/2023 10:00:00 AM
From the NAR: Existing-Home Sales Slipped 2.2% in July
Existing-home sales receded in July, according to the National Association of Realtors®. Among the four major U.S. regions, sales grew in the West but faded in the Northeast, Midwest and South. All four regions registered year-over-year sales declines.
Total existing-home sales – completed transactions that include single-family homes, townhomes, condominiums and co-ops – waned 2.2% from June to a seasonally adjusted annual rate of 4.07 million in July. Year-over-year, sales slumped 16.6% (down from 4.88 million in July 2022).
...
Total housing inventory registered at the end of July was 1.11 million units, up 3.7% from June but down 14.6% from one year ago (1.3 million). Unsold inventory sits at a 3.3-month supply at the current sales pace, up from 3.1 months in June and 3.2 months in July 2022.
emphasis added
 Click on graph for larger image.
This graph shows existing home sales, on a Seasonally Adjusted Annual Rate (SAAR) basis since 1994.
Sales in July (4.07 million SAAR) were down 2.2% from the previous month and were 16.6% below the July 2022 sales rate.
The second graph shows nationwide inventory for existing homes.
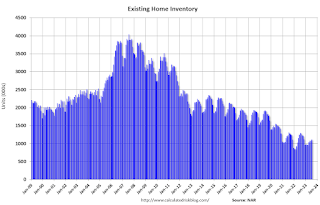 According to the NAR, inventory increased to 1.11 million in July up from 1.08 million in June.
 According to the NAR, inventory increased to 1.11 million in July up from 1.08 million in June.
Headline inventory is not seasonally adjusted, and inventory usually decreases to the seasonal lows in December and January, and peaks in mid-to-late summer.
The last graph shows the year-over-year (YoY) change in reported existing home inventory and months-of-supply. Since inventory is not seasonally adjusted, it really helps to look at the YoY change. Note: Months-of-supply is based on the seasonally adjusted sales and not seasonally adjusted inventory.
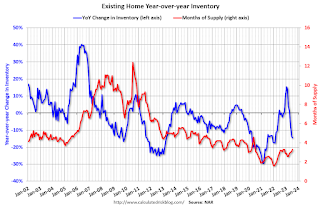 Inventory was down 14.6% year-over-year (blue) in July compared to July 2022.
Months of supply (red) increased to 3.3 months in July from 3.1 months in June.
This was below the consensus forecast. I'll have more later.
The last graph shows the year-over-year (YoY) change in reported existing home inventory and months-of-supply. Since inventory is not seasonally adjusted, it really helps to look at the YoY change. Note: Months-of-supply is based on the seasonally adjusted sales and not seasonally adjusted inventory.
 Inventory was down 14.6% year-over-year (blue) in July compared to July 2022.
 Months of supply (red) increased to 3.3 months in July from 3.1 months in June.
This was below the consensus forecast. I'll have more later.


