 RSS Feed
 by Calculated Risk on 8/25/2023 11:55:00 AM
Friday, August 25, 2023
Q3 GDP Tracking: Moving Up
From BofA:
Altogether, this decreased our 2Q GDP tracking estimate by one-tenth to 2.4% q/q saar (seasonally adjusted annual rate) and increased it by a one-tenth for 3Q to 2.8% q/q saar [Aug 24th estimate]From Goldman:
emphasis added
[W]e left our Q3 GDP tracking estimate unchanged at +2.6% (qoq ar). Our Q3 domestic final sales growth forecast stands at +2.7%. [Aug 24th estimate]And from the Altanta Fed: GDPNow
The GDPNow model estimate for real GDP growth (seasonally adjusted annual rate) in the third quarter of 2023 is 5.9 percent on August 24, up from 5.8 percent on August 16. After recent releases from the US Census Bureau and the National Association of Realtors, the nowcast of third-quarter real gross private domestic investment growth increased from 11.4 percent to 12.3 percent. [Aug 24th estimate]
Fed Chair Powell: Inflation: Progress and the Path Ahead
by Calculated Risk on 8/25/2023 10:07:00 AM
Fed Chair Powell's speech here on YouTube.
From Fed Chair Powell: Inflation: Progress and the Path Ahead
It is the Fed's job to bring inflation down to our 2 percent goal, and we will do so. We have tightened policy significantly over the past year. Although inflation has moved down from its peak—a welcome development—it remains too high. We are prepared to raise rates further if appropriate, and intend to hold policy at a restrictive level until we are confident that inflation is moving sustainably down toward our objective.
Hotels: Occupancy Rate Decreased Slightly Year-over-year
by Calculated Risk on 8/25/2023 08:21:00 AM
Following seasonal patterns, U.S. hotel performance declined from the previous week but showed most positive comparisons year over year, according to CoStar’s latest data through 19 August. ...The following graph shows the seasonal pattern for the hotel occupancy rate using the four-week average.
13-19 August 2023 (percentage change from comparable week in 2022):
• Occupancy: 67.0% (-0.1%)
• Average daily rate (ADR): US$154.10 (+1.8%)
• Revenue per available room (RevPAR): US$103.22 (+1.8%)
emphasis added
 Click on graph for larger image.
The red line is for 2023, black is 2020, blue is the median, and dashed light blue is for 2022. Dashed purple is for 2018, the record year for hotel occupancy.
The 4-week average of the occupancy rate is below the median rate for the period 2000 through 2022 (Blue).
Note: Y-axis doesn't start at zero to better show the seasonal change.
The 4-week average of the occupancy rate has peaked for the year.
Thursday, August 24, 2023
Friday: Fed Chair Powell Speaks at Jackson Hole Symposium
by Calculated Risk on 8/24/2023 08:16:00 PM
 Note: Mortgage rates are from MortgageNewsDaily.com and are for top tier scenarios.
Thursday:
• At 10:00 AM ET,: University of Michigan's Consumer sentiment index (Final for August). The consensus is for a reading of 71.2.
• At 10:05 AM, Speech, Fed Chair Jerome Powell, Economic Outlook, At the Jackson Hole Economic Policy Symposium (on YouTube)
Realtor.com Reports Weekly Active Inventory Down 7% YoY; New Listings Down 6% YoY
by Calculated Risk on 8/24/2023 03:45:00 PM
Realtor.com has monthly and weekly data on the existing home market. Here is their weekly report from Sabrina Speianu: Weekly Housing Trends View — Data Week Ending Aug 19, 2023
• Active inventory declined, with for-sale homes lagging behind year ago levels by 7.2%.
This past week marked the 9th consecutive decline in the number of homes actively for sale compared to the prior year, however the gap narrowed slightly compared to the previous week’s -8.6% figure. The existing home sales pace has been roughly consistent at a low level in recent months, suggesting affordability driven by high rates and high prices keep making sellers and buyers hold their moving plans.
• New listings–a measure of sellers putting homes up for sale–were down again this week, by 5.7% from one year ago.
For 59 weeks, there have been fewer newly listed homes compared to the same time one year ago. However, this gap has been shrinking as we start to compare against low new listings in the latter months of 2022. This week’s data shows a 2.4 percentage point improvement over last week. While it’s likely that we might see more new listings this fall than the previous year, inventory will continue to remain constrained as listings are still more than 20% below typical pre-pandemic levels seen this time of year.
 Here is a graph of the year-over-year change in inventory according to realtor.com.
 Inventory was down 7.2% year-over-year - this was the ninth consecutive week with a YoY decrease following 58 consecutive weeks with a YoY increase in inventory.
Inventory is still up from the record lows in the 2nd half of 2021 and early 2022, and it is unlikely we will see new record lows by this measure this year.
Final Look at Local Housing Markets in July
by Calculated Risk on 8/24/2023 12:58:00 PM
Today, in the Calculated Risk Real Estate Newsletter: Final Look at Local Housing Markets in July
A brief excerpt:
Each month I track closed sales, new listings and active inventory in a sample of local markets around the country (over 40 local housing markets) in the US to get an early sense of changes in the housing market. In addition, we can look for regional differences.There is much more in the article. You can subscribe at https://calculatedrisk.substack.com/
After the National Association of Realtors® (NAR) releases the monthly existing home sales report, I pick up additional local market data that is reported after the NAR (and I’m frequently adding more markets). This is the final look at local markets in July.
The big story for July existing home sales was the large year-over-year (YoY) decline in sales. Also new listings were down sharply YoY and active listings are now down YoY.
...
In July, sales in these markets were down 16.9%. In June, these same markets were down 16.9% YoY Not Seasonally Adjusted (NSA).
...
My early expectation is we will see a somewhat lower level of sales in August on a seasonally adjusted annual rate basis (SAAR) than in July.
...
More local data coming in September for activity in August!

LA Port Inbound Traffic Down Sharply YoY in July
by Calculated Risk on 8/24/2023 11:17:00 AM
Notes: The expansion to the Panama Canal was completed in 2016 (As I noted several years ago), and some of the traffic that used the ports of Los Angeles and Long Beach is probably going through the canal. This might be impacting TEUs on the West Coast.
Container traffic gives us an idea about the volume of goods being exported and imported - and usually some hints about the trade report since LA area ports handle about 40% of the nation's container port traffic.
The following graphs are for inbound and outbound traffic at the ports of Los Angeles and Long Beach in TEUs (TEUs: 20-foot equivalent units or 20-foot-long cargo container).
To remove the strong seasonal component for inbound traffic, the first graph shows the rolling 12-month average.
 Click on graph for larger image.
On a rolling 12-month basis, inbound traffic decreased 2.8% in July compared to the rolling 12 months ending in June. Outbound traffic decreased 0.5% compared to the rolling 12 months ending the previous month.
The 2nd graph is the monthly data (with a strong seasonal pattern for imports).
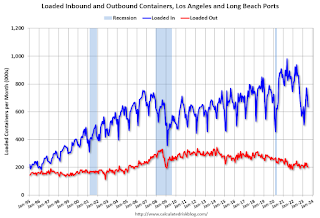 Usually imports peak in the July to October period as retailers import goods for the Christmas holiday, and then decline sharply and bottom in February or March depending on the timing of the Chinese New Year.
 Usually imports peak in the July to October period as retailers import goods for the Christmas holiday, and then decline sharply and bottom in February or March depending on the timing of the Chinese New Year.
 Imports were down 26% YoY in July, and exports were down 6% YoY. The next few months should see some pickup in imports as retailers stock up for the holidays.
The volume of containers unloaded in 2021 and 2022 was much stronger than normal because of all the ships waiting to unload due to the pandemic.
Weekly Initial Unemployment Claims Decrease to 230,000
by Calculated Risk on 8/24/2023 08:30:00 AM
The DOL reported:
In the week ending August 19, the advance figure for seasonally adjusted initial claims was 230,000, a decrease of 10,000 from the previous week's revised level. The previous week's level was revised up by 1,000 from 239,000 to 240,000. The 4-week moving average was 236,750, an increase of 2,250 from the previous week's revised average. The previous week's average was revised up by 250 from 234,250 to 234,500.The following graph shows the 4-week moving average of weekly claims since 1971.
emphasis added
 Click on graph for larger image.
The dashed line on the graph is the current 4-week average. The four-week average of weekly unemployment claims increased to 236,750.
The previous week was revised up.
Weekly claims were below the consensus forecast.
Wednesday, August 23, 2023
Thursday: Unemployment Claims, Durable Goods
by Calculated Risk on 8/23/2023 08:05:00 PM
 Note: Mortgage rates are from MortgageNewsDaily.com and are for top tier scenarios.
Thursday:
• At 8:30 AM ET, The initial weekly unemployment claims report will be released. The consensus is for 244 thousand initial claims, up from 239 thousand last week.
• Also at 8:30 AM, Chicago Fed National Activity Index for July. This is a composite index of other data.
• Also at 8:30 AM, Durable Goods Orders for July from the Census Bureau. The consensus is for a 4.0% decrease in durable goods orders.
• At 11:00 AM, the Kansas City Fed manufacturing survey for August.
August Vehicle Sales Forecast: 15.3 million SAAR, Up Sharply YoY
by Calculated Risk on 8/23/2023 05:01:00 PM
From WardsAuto: August U.S. Light-Vehicle Sales Tracking to a 19% Increase; SAAR Weakens from July (pay content). Brief excerpt:
Keeping sales from growing faster are still-elevated average vehicle prices and inventory stuck at historic lows with the mix slanted toward higher cost models and trims levels. Fleet volume in August also is not expected to rebound from a seasonal decline in July and is partly behind the expected 6.3% increase in inventory from July.
emphasis added
 Click on graph for larger image.
This graph shows actual sales from the BEA (Blue), and Wards forecast for July (Red).
On a seasonally adjusted annual rate basis, the Wards forecast of 15.3 million SAAR, would be down 3% from last month, and up 16% from a year ago.
Vehicle sales are usually a transmission mechanism for Federal Open Market Committee (FOMC) policy, although far behind housing. This time vehicle sales were more suppressed by supply chain issues and have picked up recently.


