by Calculated Risk on 8/26/2023 02:11:00 PM
Saturday, August 26, 2023
Real Estate Newsletter Articles this Week: New Home Sales increase to 714,000 Annual Rate in July
At the Calculated Risk Real Estate Newsletter this week:
• NAR: Existing-Home Sales Decreased to 4.07 million SAAR in July
• New Home Sales increase to 714,000 Annual Rate in July
• Forecast: Multifamily Starts will Decline Sharply
• Final Look at Local Housing Markets in July
• 4th Look at Local Housing Markets in July
This is usually published 4 to 6 times a week and provides more in-depth analysis of the housing market.
You can subscribe at https://calculatedrisk.substack.com/
Schedule for Week of August 27, 2023
by Calculated Risk on 8/26/2023 08:11:00 AM
The key report this week is the August employment report on Friday.
Other key indicators include the second estimate of Q2 GDP, Personal Income and Outlays for July, the August ISM manufacturing index, August auto sales, and Case-Shiller house prices for June.
10:30 AM: Dallas Fed Survey of Manufacturing Activity for August. This is the last of the regional Fed manufacturing surveys for August.
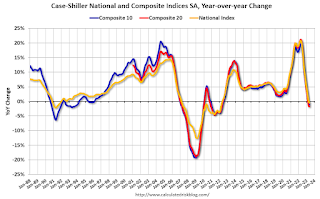 9:00 AM: S&P/Case-Shiller House Price Index for June.
This graph shows the year-over-year change in the seasonally adjusted National Index, Composite 10 and Composite 20 indexes through the most recent report (the Composite 20 was started in January 2000).
The consensus is for a 1.1% year-over-year decrease in the Comp 20 index for June.
9:00 AM: FHFA House Price Index for June. This was originally a GSE only repeat sales, however there is also an expanded index.
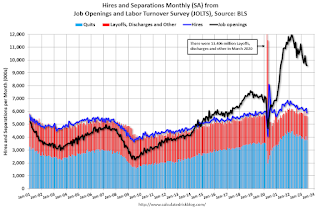 10:00 AM Job Openings and Labor Turnover Survey for July from the BLS.
 This graph shows job openings (yellow line), hires (purple), Layoff, Discharges and other (red column), and Quits (light blue column) from the JOLTS.
Jobs openings decreased in June to 9.58 million from 9.62 million in May.
The number of job openings (black) were down 13% year-over-year and Quits were down 9% year-over-year.
7:00 AM ET: The Mortgage Bankers Association (MBA) will release the results for the mortgage purchase applications index.
8:15 AM: The ADP Employment Report for August. This report is for private payrolls only (no government).
8:30 AM: Gross Domestic Product, 2nd quarter 2023 (second estimate). The consensus is that real GDP increased 2.4% annualized in Q2, unchanged from the advance estimate of 2.4% in Q2.
10:00 AM: Pending Home Sales Index for July. The consensus is for a 0.8% decrease in the index.
8:30 AM: The initial weekly unemployment claims report will be released. The consensus is for 235 thousand initial claims, up from 230 thousand last week.
8:30 AM: Personal Income and Outlays, July 2023. The consensus is for a 0.3% increase in personal income, and for a 0.7% increase in personal spending. And for the Core PCE price index to increase 0.2%. PCE prices are expected to be up 3.3% YoY, and core PCE prices up 4.2% YoY.
9:45 AM: Chicago Purchasing Managers Index for August.
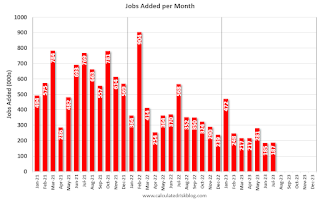 8:30 AM: Employment Report for August. The consensus is for 187,000 jobs added, and for the unemployment rate to be unchanged at 3.5%.
There were 187,000 jobs added in July, and the unemployment rate was at 3.5%.
This graph shows the jobs added per month since January 2021.
10:00 AM: ISM Manufacturing Index for August. The consensus is for the ISM to be at 46.6, up from 46.4 in July.
10:00 AM: Construction Spending for July. The consensus is for a 0.5% increase in construction spending.
 All Day: Light vehicle sales for August. The consensus is for light vehicle sales to be 15.4 million SAAR in August, down from 15.7 million in July (Seasonally Adjusted Annual Rate).
Friday, August 25, 2023
Aug 25th COVID Update: Deaths and Hospitalizations Increased
by Calculated Risk on 8/25/2023 08:09:00 PM
| COVID Metrics | ||||
|---|---|---|---|---|
| Now | Week Ago | Goal | ||
| Hospitalized2🚩 | 9,401 | 8,100 | ≤3,0001 | |
| Deaths per Week2🚩 | 551 | 497 | ≤3501 | |
| 1my goals to stop weekly posts, 2Weekly for Currently Hospitalized, and Deaths 🚩 Increasing number weekly for Hospitalized and Deaths ✅ Goal met. | ||||
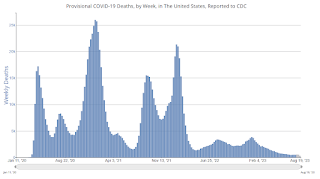 Click on graph for larger image.
This graph shows the weekly (columns) number of deaths reported.
Forecast: Multifamily Starts will Decline Sharply
by Calculated Risk on 8/25/2023 01:14:00 PM
Today, in the Calculated Risk Real Estate Newsletter: Forecast: Multifamily Starts will Decline Sharply
A brief excerpt:
In 2021 there was a sharp increase in rents. This was due to a surge in household formation during the pandemic. Over time, housing economist Tom Lawler and I unraveled the household formation mystery in a series of articles (links at the bottom of this post).There is much more in the article. You can subscribe at https://calculatedrisk.substack.com/
This analysis led to the conclusion that household formation would slow sharply, and that asking rents would likely turn negative year-over-year (both have happened). The next likely consequence is that multifamily starts will decline significantly.
Here are several data points supporting this forecast.
...
Freddie: Multifamily Delinquencies Have Tripled Year-over-year
Freddie Mac reports that multifamily delinquencies increased to 0.23% in July, up from 0.07% in July 2022.
This graph shows the Freddie multi-family serious delinquency rate since 2012. Rates were still high in 2012 following the housing bust and financial crisis.
The multi-family delinquency rate increased following the pandemic and then recovered as rents soared. The rate has increased recently as asking rents softened, vacancy rates increased, lending has tightened, and interest rates have increased sharply.
Q3 GDP Tracking: Moving Up
by Calculated Risk on 8/25/2023 11:55:00 AM
From BofA:
Altogether, this decreased our 2Q GDP tracking estimate by one-tenth to 2.4% q/q saar (seasonally adjusted annual rate) and increased it by a one-tenth for 3Q to 2.8% q/q saar [Aug 24th estimate]From Goldman:
emphasis added
[W]e left our Q3 GDP tracking estimate unchanged at +2.6% (qoq ar). Our Q3 domestic final sales growth forecast stands at +2.7%. [Aug 24th estimate]And from the Altanta Fed: GDPNow
The GDPNow model estimate for real GDP growth (seasonally adjusted annual rate) in the third quarter of 2023 is 5.9 percent on August 24, up from 5.8 percent on August 16. After recent releases from the US Census Bureau and the National Association of Realtors, the nowcast of third-quarter real gross private domestic investment growth increased from 11.4 percent to 12.3 percent. [Aug 24th estimate]
Fed Chair Powell: Inflation: Progress and the Path Ahead
by Calculated Risk on 8/25/2023 10:07:00 AM
Fed Chair Powell's speech here on YouTube.
From Fed Chair Powell: Inflation: Progress and the Path Ahead
It is the Fed's job to bring inflation down to our 2 percent goal, and we will do so. We have tightened policy significantly over the past year. Although inflation has moved down from its peak—a welcome development—it remains too high. We are prepared to raise rates further if appropriate, and intend to hold policy at a restrictive level until we are confident that inflation is moving sustainably down toward our objective.
Hotels: Occupancy Rate Decreased Slightly Year-over-year
by Calculated Risk on 8/25/2023 08:21:00 AM
Following seasonal patterns, U.S. hotel performance declined from the previous week but showed most positive comparisons year over year, according to CoStar’s latest data through 19 August. ...The following graph shows the seasonal pattern for the hotel occupancy rate using the four-week average.
13-19 August 2023 (percentage change from comparable week in 2022):
• Occupancy: 67.0% (-0.1%)
• Average daily rate (ADR): US$154.10 (+1.8%)
• Revenue per available room (RevPAR): US$103.22 (+1.8%)
emphasis added
 Click on graph for larger image.
The red line is for 2023, black is 2020, blue is the median, and dashed light blue is for 2022. Dashed purple is for 2018, the record year for hotel occupancy.
Thursday, August 24, 2023
Friday: Fed Chair Powell Speaks at Jackson Hole Symposium
by Calculated Risk on 8/24/2023 08:16:00 PM

Thursday:
• At 10:00 AM ET,: University of Michigan's Consumer sentiment index (Final for August). The consensus is for a reading of 71.2.
• At 10:05 AM, Speech, Fed Chair Jerome Powell, Economic Outlook, At the Jackson Hole Economic Policy Symposium (on YouTube)
Realtor.com Reports Weekly Active Inventory Down 7% YoY; New Listings Down 6% YoY
by Calculated Risk on 8/24/2023 03:45:00 PM
Realtor.com has monthly and weekly data on the existing home market. Here is their weekly report from Sabrina Speianu: Weekly Housing Trends View — Data Week Ending Aug 19, 2023
• Active inventory declined, with for-sale homes lagging behind year ago levels by 7.2%.
This past week marked the 9th consecutive decline in the number of homes actively for sale compared to the prior year, however the gap narrowed slightly compared to the previous week’s -8.6% figure. The existing home sales pace has been roughly consistent at a low level in recent months, suggesting affordability driven by high rates and high prices keep making sellers and buyers hold their moving plans.
• New listings–a measure of sellers putting homes up for sale–were down again this week, by 5.7% from one year ago.
For 59 weeks, there have been fewer newly listed homes compared to the same time one year ago. However, this gap has been shrinking as we start to compare against low new listings in the latter months of 2022. This week’s data shows a 2.4 percentage point improvement over last week. While it’s likely that we might see more new listings this fall than the previous year, inventory will continue to remain constrained as listings are still more than 20% below typical pre-pandemic levels seen this time of year.
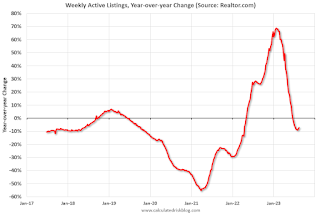 Here is a graph of the year-over-year change in inventory according to realtor.com.
 Inventory was down 7.2% year-over-year - this was the ninth consecutive week with a YoY decrease following 58 consecutive weeks with a YoY increase in inventory.
Final Look at Local Housing Markets in July
by Calculated Risk on 8/24/2023 12:58:00 PM
Today, in the Calculated Risk Real Estate Newsletter: Final Look at Local Housing Markets in July
A brief excerpt:
Each month I track closed sales, new listings and active inventory in a sample of local markets around the country (over 40 local housing markets) in the US to get an early sense of changes in the housing market. In addition, we can look for regional differences.There is much more in the article. You can subscribe at https://calculatedrisk.substack.com/
After the National Association of Realtors® (NAR) releases the monthly existing home sales report, I pick up additional local market data that is reported after the NAR (and I’m frequently adding more markets). This is the final look at local markets in July.
The big story for July existing home sales was the large year-over-year (YoY) decline in sales. Also new listings were down sharply YoY and active listings are now down YoY.
...
In July, sales in these markets were down 16.9%. In June, these same markets were down 16.9% YoY Not Seasonally Adjusted (NSA).
...
My early expectation is we will see a somewhat lower level of sales in August on a seasonally adjusted annual rate basis (SAAR) than in July.
...
More local data coming in September for activity in August!


