by Calculated Risk on 8/31/2023 08:40:00 AM
Thursday, August 31, 2023
Personal Income increased 0.2% in July; Spending increased 0.8%
The BEA released the Personal Income and Outlays report for July:
Personal income increased $45.0 billion (0.2 percent at a monthly rate) in July, according to estimates released today by the Bureau of Economic Analysis. Disposable personal income (DPI), personal income less personal current taxes, increased $7.3 billion (less than 0.1 percent) and personal consumption expenditures (PCE) increased $144.6 billion (0.8 percent).The July PCE price index increased 3.3 percent year-over-year (YoY), up from 3.0 percent YoY in June, and down from the recent peak of 7.0 percent in June 2022.
The PCE price index increased 0.2 percent. Excluding food and energy, the PCE price index increased 0.2 percent. Real DPI decreased 0.2 percent in July and real PCE increased 0.6 percent; goods increased 0.9 percent and services increased 0.4 percent.
emphasis added
The following graph shows real Personal Consumption Expenditures (PCE) through July 2023 (2012 dollars). Note that the y-axis doesn't start at zero to better show the change.
 Click on graph for larger image.
The dashed red lines are the quarterly levels for real PCE.
Personal income was slightly below expectations, and PCE was slightly above expectations.
Weekly Initial Unemployment Claims Decrease to 228,000
by Calculated Risk on 8/31/2023 08:30:00 AM
The DOL reported:
In the week ending August 26, the advance figure for seasonally adjusted initial claims was 228,000, a decrease of 4,000 from the previous week's revised level. The previous week's level was revised up by 2,000 from 230,000 to 232,000. The 4-week moving average was 237,500, an increase of 250 from the previous week's revised average. The previous week's average was revised up by 500 from 236,750 to 237,250.The following graph shows the 4-week moving average of weekly claims since 1971.
emphasis added
 Click on graph for larger image.
The dashed line on the graph is the current 4-week average. The four-week average of weekly unemployment claims increased to 237,500.
The previous week was revised up.
Weekly claims were close to the consensus forecast.
Wednesday, August 30, 2023
Thursday: Unemployment Claims, Personal Income and Outlays, Chicago PMI
by Calculated Risk on 8/30/2023 09:05:00 PM

Thursday:
• At 8:30 AM ET, The initial weekly unemployment claims report will be released. The consensus is for 235 thousand initial claims, up from 230 thousand last week.
• At 8:30 AM, Personal Income and Outlays, July 2023. The consensus is for a 0.3% increase in personal income, and for a 0.7% increase in personal spending. And for the Core PCE price index to increase 0.2%. PCE prices are expected to be up 3.3% YoY, and core PCE prices up 4.2% YoY.
• At 9:45 AM, Chicago Purchasing Managers Index for August.
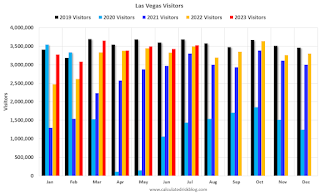
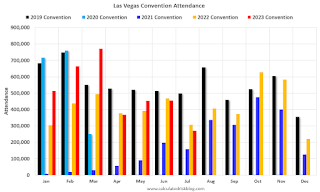
Las Vegas July 2023: Visitor Traffic Up 1.0% YoY; Convention Traffic Down 16.8% YoY
by Calculated Risk on 8/30/2023 05:01:00 PM
From the Las Vegas Visitor Authority: July 2023 Las Vegas Visitor Statistics
With the highest July Occupancy since before the pandemic, Las Vegas visitation surpassed 3.5M visitors, approximately 1% ahead of last July.
Overall hotel occupancy reached 85.2% for the month (+1.8 pts YoY) as Weekend occupancy reaching 92.6% (+1.5 pts YoY), and Midweek occupancy reached 82.2%, surpassing last July by 3.1 pts.
With YoY growth stabilizing after the dramatic post‐pandemic surges last year, ADR reached $163, +1.7% YoY while RevPAR reached $139, +3.9% YoY.
 Click on graph for larger image.
 The first graph shows visitor traffic for 2019 (Black), 2020 (light blue), 2021 (purple), 2022 (orange), and 2023 (red).
Visitor traffic was up 1.0% compared to last July.
Note: There was almost no convention traffic from April 2020 through May 2021.
Inflation Adjusted House Prices 3.9% Below Peak; Price-to-rent index is 7.6% below recent peak
by Calculated Risk on 8/30/2023 12:22:00 PM
Today, in the Calculated Risk Real Estate Newsletter: Inflation Adjusted House Prices 3.9% Below Peak; Price-to-rent index is 7.6% below recent peak
Excerpt:
It has been over 17 years since the bubble peak. In the June Case-Shiller house price index released yesterday, the seasonally adjusted National Index (SA), was reported as being 65% above the bubble peak in 2006. However, in real terms, the National index (SA) is about 9% above the bubble peak (and historically there has been an upward slope to real house prices). The composite 20, in real terms, is 1% below the bubble peak.
People usually graph nominal house prices, but it is also important to look at prices in real terms. As an example, if a house price was $200,000 in January 2000, the price would be $359,000 today adjusted for inflation (79.5% increase). That is why the second graph below is important - this shows "real" prices.
The third graph shows the price-to-rent ratio, and the fourth graph is the affordability index. The last graph shows the 5-year real return based on the Case-Shiller National Index.
NAR: Pending Home Sales Up 0.9% in July; Down 14.0% Year-over-year
by Calculated Risk on 8/30/2023 10:03:00 AM
From the NAR: Pending Home Sales Elevated 0.9% in July, Marking Second Consecutive Monthly Increase
Pending home sales increased 0.9% in July – rising for the second consecutive month – according to the National Association of REALTORS®. The Northeast and Midwest posted monthly losses, while sales in the South and West grew. All four U.S. regions saw year-over-year declines in transactions.This above expectations of a 0.8% decrease for this index. Note: Contract signings usually lead sales by about 45 to 60 days, so this would usually be for closed sales in August and September.
The Pending Home Sales Index (PHSI)* – a forward-looking indicator of home sales based on contract signings – rose 0.9% to 77.6 in July. Year over year, pending transactions fell by 14.0%. An index of 100 is equal to the level of contract activity in 2001.
"The small gain in contract signings shows the potential for further increases in light of the fact that many people have lost out on multiple home buying offers," said NAR Chief Economist Lawrence Yun. "Jobs are being added and, thereby, enlarging the pool of prospective home buyers. However, rising mortgage rates and limited inventory have temporarily hindered the possibility of buying for many."
...
The Northeast PHSI shrank 5.8% from last month to 63.2, a decrease of 20.2% from July 2022. The Midwest index fell 0.4% to 77.5 in July, down 16.0% from one year ago.
The South PHSI lifted 2.0% to 95.3 in July, declining 10.9% from the prior year. The West index improved 6.2% in July to 61.3, dropping 12.8% from July 2022.
emphasis added
Q2 GDP Growth Revised down to 2.1% Annual Rate
by Calculated Risk on 8/30/2023 08:34:00 AM
From the BEA: Gross Domestic Product, Second Quarter 2023 (Second Estimate) and Corporate Profits (Preliminary)
Real gross domestic product (GDP) increased at an annual rate of 2.1 percent in the second quarter of 2023, according to the "second" estimate released by the Bureau of Economic Analysis. In the first quarter, real GDP increased 2.0 percent.Here is a Comparison of Second and Advance Estimates. PCE growth was revised up from 1.6% to 1.7%. Residential investment was revised up from -4.2% to -3.6%.
The GDP estimate released today is based on more complete source data than were available for the "advance" estimate issued last month. In the advance estimate, the increase in real GDP was 2.4 percent (refer to "Updates to GDP"). The updated estimates primarily reflected downward revisions to private inventory investment and nonresidential fixed investment that were partly offset by an upward revision to state and local government spending.
The increase in real GDP reflected increases in consumer spending, nonresidential fixed investment, state and local government spending, and federal government spending that were partly offset by decreases in exports, residential fixed investment, and private inventory investment. Imports, which are a subtraction in the calculation of GDP, decreased.
emphasis added
ADP: Private Employment Increased 177,000 in August
by Calculated Risk on 8/30/2023 08:18:00 AM
Private sector employment increased by 177,000 jobs in August and annual pay was up 5.9 percent year-over-year, according to the August ADP® National Employment ReportTM produced by the ADP Research Institute® in collaboration with the Stanford Digital Economy Lab (“Stanford Lab”).This was below the consensus forecast of 194,000. The BLS report will be released Friday, and the consensus is for 187 thousand non-farm payroll jobs added in August.
...
“This month's numbers are consistent with the pace of job creation before the pandemic,” said Nela Richardson, chief economist, ADP. “After two years of exceptional gains tied to the recovery, we're moving toward more sustainable growth in pay and employment as the economic effects of the pandemic recede.”
emphasis added
MBA: Mortgage Applications Increased in Weekly Survey
by Calculated Risk on 8/30/2023 07:00:00 AM
From the MBA: Mortgage Applications Increase in Latest MBA Weekly Survey
Mortgage applications increased 2.3 percent from one week earlier, according to data from the Mortgage Bankers Association’s (MBA) Weekly Mortgage Applications Survey for the week ending August 25, 2023.
The Market Composite Index, a measure of mortgage loan application volume, increased 2.3 percent on a seasonally adjusted basis from one week earlier. On an unadjusted basis, the Index increased 1 percent compared with the previous week. The Refinance Index increased 3 percent from the previous week and was 28 percent lower than the same week one year ago. The seasonally adjusted Purchase Index increased 2 percent from one week earlier. The unadjusted Purchase Index decreased 0.3 percent compared with the previous week and was 27 percent lower than the same week one year ago.
“Mortgage rates were mostly unchanged last week, with the 30-year fixed rate remaining at 7.31 percent – the highest since December 2000. Treasury yields peaked early in the week and did move lower by the end, which may have spurred some activity,” said Joel Kan, MBA’s Vice President and Deputy Chief Economist. “Mortgage applications for home purchases and refinances increased for the first time in five weeks but remained at low levels. Purchase applications increased but were still 27 percent lower than a year ago, as elevated mortgage rates and tight housing inventory continue to weigh on home buying activity.”
...
The average contract interest rate for 30-year fixed-rate mortgages with conforming loan balances ($726,200 or less) remained unchanged at 7.31 percent, with points decreasing to 0.73 from 0.78 (including the origination fee) for 80 percent loan-to-value ratio (LTV) loans. The effective rate decreased from last week.
emphasis added
 Click on graph for larger image.
The first graph shows the MBA mortgage purchase index.
According to the MBA, purchase activity is down 27% year-over-year unadjusted.

Tuesday, August 29, 2023
Wednesday: ADP Employment, GDP, Pending Home Sales
by Calculated Risk on 8/29/2023 08:26:00 PM

Wednesday:
• At 7:00 AM ET, The Mortgage Bankers Association (MBA) will release the results for the mortgage purchase applications index.
• At 8:15 AM, The ADP Employment Report for August. This report is for private payrolls only (no government).
• At 8:30 AM, Gross Domestic Product, 2nd quarter 2023 (second estimate). The consensus is that real GDP increased 2.4% annualized in Q2, unchanged from the advance estimate of 2.4% in Q2.
• At 10:00 AM, Pending Home Sales Index for July. The consensus is for a 0.8% decrease in the index.


