 RSS Feed
 by Calculated Risk on 9/01/2023 08:30:00 AM
Friday, September 01, 2023
August Employment Report: 187 thousand Jobs, 3.8% Unemployment Rate
From the BLS:
Total nonfarm payroll employment increased by 187,000 in August, and the unemployment rate rose to 3.8 percent, the U.S. Bureau of Labor Statistics reported today. Employment continued to trend up in health care, leisure and hospitality, social assistance, and construction. Employment in transportation and warehousing declined.
...
The change in total nonfarm payroll employment for June was revised down by 80,000, from +185,000 to +105,000, and the change for July was revised down by 30,000, from +187,000 to +157,000. With these revisions, employment in June and July combined is 110,000 lower than previously reported.
emphasis added
 Click on graph for larger image.
The first graph shows the jobs added per month since January 2021.
Total payrolls increased by 187 thousand in August. Private payrolls increased by 179 thousand, and public payrolls increased 8 thousand.
Payrolls for June and July were revised down 110 thousand, combined.
Payrolls for June and July were revised down 110 thousand, combined.
 The second graph shows the year-over-year change in total non-farm employment since 1968.
In August, the year-over-year change was 3.09 million jobs. Employment was up significantly year-over-year but has slowed to more normal levels of job growth recently.
The third graph shows the employment population ratio and the participation rate.
 The Labor Force Participation Rate was increased to 62.8% in August, from 62.6% in July. This is the percentage of the working age population in the labor force.
 The Employment-Population ratio was unchanged at 60.4% from 60.4% (blue line).
I'll post the 25 to 54 age group employment-population ratio graph later.
 The fourth graph shows the unemployment rate.
 The unemployment rate decreased in August to 3.8% from 3.5% in July.
This was at consensus expectations; however, June and July payrolls were revised down by 110,000 combined.
Thursday, August 31, 2023
Friday: Employment Report, ISM Mfg, Construction Spending, Vehicle Sales
by Calculated Risk on 8/31/2023 08:51:00 PM
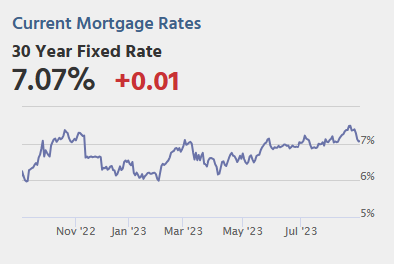 Note: Mortgage rates are from MortgageNewsDaily.com and are for top tier scenarios.
Thursday:
• At 8:30 AM ET, Employment Report for August. The consensus is for 187,000 jobs added, and for the unemployment rate to be unchanged at 3.5%.
• At 10:00 AM, ISM Manufacturing Index for August. The consensus is for the ISM to be at 46.6, up from 46.4 in July.
• At 10:00 AM, Construction Spending for July. The consensus is for a 0.5% increase in construction spending.
• All Day, Light vehicle sales for August. The consensus is for light vehicle sales to be 15.4 million SAAR in August, down from 15.7 million in July (Seasonally Adjusted Annual Rate).
Goldman August Payrolls Preview
by Calculated Risk on 8/31/2023 06:01:00 PM
A few brief excerpts from a note by Goldman Sachs economist Spencer Hill:
"We estimate nonfarm payrolls rose by 149k in August (mom sa), below consensus of +170k. ... our forecast embeds a 26k one-time drag from the combination of Hollywood worker strikes (-18k) and Yellow trucking layoffs (-8k) ... We estimate that the unemployment rate was unchanged at 3.5%—in line with consensus—reflecting a modest rise in household employment and unchanged labor force participation (at 62.6%)."
emphasis added
Asking Rents Down 1.2% Year-over-year
by Calculated Risk on 8/31/2023 03:32:00 PM
Today, in the Calculated Risk Real Estate Newsletter: Asking Rents Down 1.2% Year-over-year
A brief excerpt:
Tracking rents is important for understanding the dynamics of the housing market. For example, the sharp increase in rents helped me deduce that there was a surge in household formation in 2021 (See from September 2021: Household Formation Drives Housing Demand).There is much more in the article. You can subscribe at https://calculatedrisk.substack.com/
The surge in household formation has been confirmed (mostly due to work-from-home), and this also led to the supposition that household formation would slow sharply in 2023 (mostly confirmed) and that asking rents might decrease in 2023 on a year-over-year basis (now flat year-over-year).
...
Here is a graph of the year-over-year (YoY) change for these measures since January 2015. Most of these measures are through July 2023, except CoreLogic is through June and Apartment List is through August 2023.
...
The CoreLogic measure is up 3.3% YoY in June, down from 3.4% in May, and down from a peak of 13.9% in April 2022.
The Zillow measure is up 3.6% YoY in July, down from 4.1% YoY in June, and down from a peak of 16.2% YoY in March 2022.
The ApartmentList measure is down 1.2% YoY as of August, down from -0.8% in June, and down from a peak of 18.1% YoY November 2021.
...
With slow household formation, more supply coming on the market and a rising vacancy rate, rents will be under pressure all year. See: Forecast: Multifamily Starts will Decline Sharply

Realtor.com Reports Weekly Active Inventory Down 6% YoY; New Listings Down 8% YoY
by Calculated Risk on 8/31/2023 12:32:00 PM
Realtor.com has monthly and weekly data on the existing home market. Here is their weekly report from Hannah Jones: Weekly Housing Trends View — Data Week Ending Aug 26, 2023
• Active inventory declined, with for-sale homes lagging behind year ago levels by 5.9%. This past week marked the 10th consecutive decline in the number of homes actively for sale compared to the prior year, however the gap narrowed for the fourth week in a row.
• New listings–a measure of sellers putting homes up for sale–were down again this week, by 8.8% from one year ago. For 60 weeks, there have been fewer newly listed homes compared to the same time one year ago. This gap has been shrinking, but reversed trend this week. This week’s data shows a 3.1 percentage point widening compared to last week.
 Here is a graph of the year-over-year change in inventory according to realtor.com.
 Inventory was down 7.2% year-over-year - this was the tenth consecutive week with a YoY decrease following 58 consecutive weeks with a YoY increase in inventory.
Inventory is still up from the record lows in the 2nd half of 2021 and early 2022, and it is unlikely we will see new record lows by this measure this year.
PCE Measure of Shelter Slows to 7.8% YoY in July
by Calculated Risk on 8/31/2023 09:06:00 AM
Here is a graph of the year-over-year change in shelter from the CPI report and housing from the PCE report this morning, both through July 2023.
 CPI Shelter was up 7.7% year-over-year in July, down from 7.8% in June, and down from the cycle peak of 8.2% in March 2023.
Housing (PCE) was up 7.8% YoY in July, down from 8.0% in June, and down from the cycle peak of 8.4% in April 2023.
Since asking rents are slightly negative year-over-year, these measures will slow sharply in coming months.
Since asking rents are slightly negative year-over-year, these measures will slow sharply in coming months.
Personal Income increased 0.2% in July; Spending increased 0.8%
by Calculated Risk on 8/31/2023 08:40:00 AM
The BEA released the Personal Income and Outlays report for July:
Personal income increased $45.0 billion (0.2 percent at a monthly rate) in July, according to estimates released today by the Bureau of Economic Analysis. Disposable personal income (DPI), personal income less personal current taxes, increased $7.3 billion (less than 0.1 percent) and personal consumption expenditures (PCE) increased $144.6 billion (0.8 percent).The July PCE price index increased 3.3 percent year-over-year (YoY), up from 3.0 percent YoY in June, and down from the recent peak of 7.0 percent in June 2022.
The PCE price index increased 0.2 percent. Excluding food and energy, the PCE price index increased 0.2 percent. Real DPI decreased 0.2 percent in July and real PCE increased 0.6 percent; goods increased 0.9 percent and services increased 0.4 percent.
emphasis added
The PCE price index, excluding food and energy, increased 4.2 percent YoY, up from 4.1 percent in June, and down from the recent peak of 5.4 percent in February 2022.
The following graph shows real Personal Consumption Expenditures (PCE) through July 2023 (2012 dollars). Note that the y-axis doesn't start at zero to better show the change.
 Click on graph for larger image.
The dashed red lines are the quarterly levels for real PCE.
Personal income was slightly below expectations, and PCE was slightly above expectations.
Inflation was at expectations.
Weekly Initial Unemployment Claims Decrease to 228,000
by Calculated Risk on 8/31/2023 08:30:00 AM
The DOL reported:
In the week ending August 26, the advance figure for seasonally adjusted initial claims was 228,000, a decrease of 4,000 from the previous week's revised level. The previous week's level was revised up by 2,000 from 230,000 to 232,000. The 4-week moving average was 237,500, an increase of 250 from the previous week's revised average. The previous week's average was revised up by 500 from 236,750 to 237,250.The following graph shows the 4-week moving average of weekly claims since 1971.
emphasis added
 Click on graph for larger image.
The dashed line on the graph is the current 4-week average. The four-week average of weekly unemployment claims increased to 237,500.
The previous week was revised up.
Weekly claims were close to the consensus forecast.
Wednesday, August 30, 2023
Thursday: Unemployment Claims, Personal Income and Outlays, Chicago PMI
by Calculated Risk on 8/30/2023 09:05:00 PM
 Note: Mortgage rates are from MortgageNewsDaily.com and are for top tier scenarios.
Thursday:
• At 8:30 AM ET, The initial weekly unemployment claims report will be released. The consensus is for 235 thousand initial claims, up from 230 thousand last week.
• At 8:30 AM, Personal Income and Outlays, July 2023. The consensus is for a 0.3% increase in personal income, and for a 0.7% increase in personal spending. And for the Core PCE price index to increase 0.2%. PCE prices are expected to be up 3.3% YoY, and core PCE prices up 4.2% YoY.
• At 9:45 AM, Chicago Purchasing Managers Index for August.
Las Vegas July 2023: Visitor Traffic Up 1.0% YoY; Convention Traffic Down 16.8% YoY
by Calculated Risk on 8/30/2023 05:01:00 PM
From the Las Vegas Visitor Authority: July 2023 Las Vegas Visitor Statistics
With the highest July Occupancy since before the pandemic, Las Vegas visitation surpassed 3.5M visitors, approximately 1% ahead of last July.
Overall hotel occupancy reached 85.2% for the month (+1.8 pts YoY) as Weekend occupancy reaching 92.6% (+1.5 pts YoY), and Midweek occupancy reached 82.2%, surpassing last July by 3.1 pts.
With YoY growth stabilizing after the dramatic post‐pandemic surges last year, ADR reached $163, +1.7% YoY while RevPAR reached $139, +3.9% YoY.
 Click on graph for larger image.
 The first graph shows visitor traffic for 2019 (Black), 2020 (light blue), 2021 (purple), 2022 (orange), and 2023 (red).
Visitor traffic was up 1.0% compared to last July.
Visitor traffic was down 4.3% compared to the same month in 2019.
Note: There was almost no convention traffic from April 2020 through May 2021.
The second graph shows convention traffic.
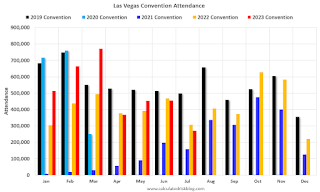
Convention traffic was down 16.8% compared to July 2022, and down 45.8% compared to July 2019.
Note: There was almost no convention traffic from April 2020 through May 2021.


