 RSS Feed
 by Calculated Risk on 9/03/2023 08:21:00 AM
Sunday, September 03, 2023
Hotels: Occupancy Rate Increased 0.4% Year-over-year
Following seasonal patterns, U.S. hotel performance declined from the previous week but showed positive comparisons year over year, according to CoStar’s latest data through 26 August. ...The following graph shows the seasonal pattern for the hotel occupancy rate using the four-week average.
20-26 August 2023 (percentage change from comparable week in 2022):
• Occupancy: 65.0% (+0.4%)
• Average daily rate (ADR): US$150.23 (+1.7%)
• Revenue per available room (RevPAR): US$97.62 (+2.1%)
emphasis added
 Click on graph for larger image.
The red line is for 2023, black is 2020, blue is the median, and dashed light blue is for 2022. Dashed purple is for 2018, the record year for hotel occupancy.
The 4-week average of the occupancy rate is tracking last year, and slightly below the median rate for the period 2000 through 2022 (Blue).
Note: Y-axis doesn't start at zero to better show the seasonal change.
The 4-week average of the occupancy rate has peaked for the year.
Saturday, September 02, 2023
Real Estate Newsletter Articles this Week: Case-Shiller: National House Price Index Unchanged year-over-year
by Calculated Risk on 9/02/2023 02:11:00 PM
At the Calculated Risk Real Estate Newsletter this week:
• Case-Shiller: National House Price Index Unchanged year-over-year in June
• Inflation Adjusted House Prices 3.9% Below Peak
• Asking Rents Down 1.2% Year-over-year
• Fannie Mae Single-Family Mortgage Serious Delinquency Rate Lowest since 2002
• Freddie Mac House Price Index Increased in July to New High; Up 2.9% Year-over-year Black Knight House Price Index Hits New High, but "Mixed signals"
This is usually published 4 to 6 times a week and provides more in-depth analysis of the housing market.
You can subscribe at https://calculatedrisk.substack.com/
Schedule for Week of September 3, 2023
by Calculated Risk on 9/02/2023 10:41:00 AM
This will be a light week for economic data. The key report is the July trade balance.
All US markets will be closed in observance of the Labor Day holiday.
8:00 AM ET: Corelogic House Price index for July
7:00 AM ET: The Mortgage Bankers Association (MBA) will release the results for the mortgage purchase applications index.
 8:30 AM: Trade Balance report for July from the Census Bureau.
 This graph shows the U.S. trade deficit, with and without petroleum, through the most recent report. The blue line is the total deficit, and the black line is the petroleum deficit, and the red line is the trade deficit ex-petroleum products.
The consensus is for the U.S. trade deficit to be $65.85 billion in July, from $65.5 billion in June.
10:00 AM: the ISM Services Index for August. The consensus is for a reading of 52.6, down from 52.7.
2:00 PM: the Federal Reserve Beige Book, an informal review by the Federal Reserve Banks of current economic conditions in their Districts.
8:30 AM: The initial weekly unemployment claims report will be released.
12:00 PM: Q2 Flow of Funds Accounts of the United States from the Federal Reserve.
Friday, September 01, 2023
Sept 1st COVID Update: Deaths and Hospitalizations Increased
by Calculated Risk on 9/01/2023 08:19:00 PM
 Note: Mortgage rates are from MortgageNewsDaily.com and are for top tier scenarios.
Due to changes at the CDC, weekly cases are no longer updated.
After the first few weeks, the pandemic low for weekly deaths had been the week of July 7, 2021, at 1,690 deaths (until recently).
Recently hospitalizations have more than doubled from a low of 5,150 in June 2023.
| COVID Metrics | ||||
|---|---|---|---|---|
| Now | Week Ago | Goal | ||
| Hospitalized2🚩 | 11,165 | 9,452 | ≤3,0001 | |
| Deaths per Week2🚩 | 641 | 616 | ≤3501 | |
| 1my goals to stop weekly posts, 2Weekly for Currently Hospitalized, and Deaths 🚩 Increasing number weekly for Hospitalized and Deaths ✅ Goal met. | ||||
 Click on graph for larger image.
This graph shows the weekly (columns) number of deaths reported.
Weekly deaths have increased from a record low of 469 in early July.
For deaths, I'm currently using 3 weeks ago for "now", since the most recent two weeks will be revised significantly.
Vehicles Sales at 15.04 million SAAR in August; Up 14% YoY
by Calculated Risk on 9/01/2023 06:34:00 PM
Wards Auto released their estimate of light vehicle sales for August: August U.S. Light-Vehicle Sales Rise but Miss Expectations (pay site).
Lean inventory, elevated prices and lukewarm incentives, combined with rising interest rates, could be keeping more buyers out of the market. Some could be waiting for more deals which often was the case in the summer months in most years prior to the pandemic’s start in 2020, as automakers and dealers offloaded excess inventory before widespread availability of next model-year vehicles in the fourth quarter – a strategy not used in recent years, including 2023, due to a lack of excess inventory caused by the pandemic/supply-chain disruptions.
 Click on graph for larger image.
This graph shows light vehicle sales since 2006 from the BEA (blue) and Wards Auto's estimate for August (red).
The impact of COVID-19 was significant, and April 2020 was the worst month. After April 2020, sales increased, and were close to sales in 2019 (the year before the pandemic). However, sales decreased in 2021 due to supply issues. The "supply chain bottom" was in September 2021.
 The second graph shows light vehicle sales since the BEA started keeping data in 1967.
 Sales in August were below the consensus forecast.
Q3 GDP Tracking
by Calculated Risk on 9/01/2023 03:44:00 PM
From BofA (last week estimate):
Altogether, this decreased our 2Q GDP tracking estimate by one-tenth to 2.4% q/q saar (seasonally adjusted annual rate) and increased it by a one-tenth for 3Q to 2.8% q/q saar [Aug 24th estimate]From Goldman:
emphasis added
We boosted our Q3 GDP tracking estimate by one tenth to +2.9% (qoq ar) and our Q3 domestic final sales growth forecast by the same amount to +2.8%. [Sept 1st estimate]And from the Altanta Fed: GDPNow
The GDPNow model estimate for real GDP growth (seasonally adjusted annual rate) in the third quarter of 2023 is 5.6 percent on September 1, unchanged from August 31 after rounding. [Sept 1st estimate]
Freddie Mac House Price Index Increased in July to New High; Black Knight Index Hits New High, but "Mixed signals"
by Calculated Risk on 9/01/2023 11:04:00 AM
Today, in the Calculated Risk Real Estate Newsletter: Freddie Mac House Price Index Increased in July to New High; Up 2.9% Year-over-year; Black Knight Index Hits New High, but "Mixed signals"
A brief excerpt:
On a year-over-year basis, the National FMHPI was up 2.9% in July, from up 1.6% YoY in June. The YoY increase peaked at 19.2% in July 2021. ...There is much more in the article. You can subscribe at https://calculatedrisk.substack.com/
In July, 14 states and D.C. were below their previous peaks, Seasonally Adjusted. The largest seasonally adjusted declines from the recent peak were in Hawaii (-6.4%), Idaho (-5.9%), Nevada (-4.6%), Utah (-4.2%), and Arizona (-4.1%).
For cities (Core-based Statistical Areas, CBSA), here are the 30 cities with the largest declines from the peak, seasonally adjusted.
...
“While home prices rose on both seasonally adjusted and non-adjusted bases, July’s 0.23% non-adjusted month-over-month growth was smaller than the 0.34% non-adjusted increase July has seen on average over the past 25 years, suggesting a possible transition may be underway,” [Black Knight Vice President of Enterprise Research Andy] Walden continued. “Indeed – in addition to monthly gains slowing below long-term averages – Black Knight rate lock and sales transaction data also points to lower average purchase prices and seasonally adjusted price per square foot among recent sales."
The Black Knight suggests we will see new highs for the next few months, but that there may be some house price weakness late this year.

Construction Spending Increased 0.7% in July
by Calculated Risk on 9/01/2023 10:41:00 AM
From the Census Bureau reported that overall construction spending increased:
Construction spending during July 2023 was estimated at a seasonally adjusted annual rate of $1,972.6 billion, 0.7 percent above the revised June estimate of $1,958.9 billion. The July figure is 5.5 percent above the July 2022 estimate of $1,869.3 billion.Private spending increased and public spending decreased:
emphasis added
Spending on private construction was at a seasonally adjusted annual rate of $1,548.9 billion, 1.0 percent above the revised June estimate of $1,533.7 billion. ...
In July, the estimated seasonally adjusted annual rate of public construction spending was $423.7 billion, 0.4 percent below the revised June estimate of $425.2 billion.
 Click on graph for larger image.
This graph shows private residential and nonresidential construction spending, and public spending, since 1993. Note: nominal dollars, not inflation adjusted.
Residential (red) spending is 9.4% below the recent peak.
Non-residential (blue) spending is close to the peak in May 2023.
Public construction spending is close to the peak last month.
 The second graph shows the year-over-year change in construction spending.
On a year-over-year basis, private residential construction spending is down 5.4%. Non-residential spending is up 19.8% year-over-year. Public spending is up 11.4% year-over-year.
This was above consensus expectations for 0.5% increase in spending and construction spending for the previous two months was revised up, combined.
ISM® Manufacturing index Increased to 47.6% in August
by Calculated Risk on 9/01/2023 10:00:00 AM
(Posted with permission). The ISM manufacturing index indicated contraction. The PMI® was at 47.6% in August, up from 46.4% in July. The employment index was at 48.5%, up from 44.4% the previous month, and the new orders index was at 46.8%, down from 47.3%.
From ISM: Manufacturing PMI® at 47.6% August 2023 Manufacturing ISM® Report On Business®
Economic activity in the manufacturing sector contracted in August for the 10th consecutive month following a 28-month period of growth, say the nation's supply executives in the latest Manufacturing ISM® Report On Business®.This suggests manufacturing contracted in August. This was above the consensus forecast.
The report was issued today by Timothy R. Fiore, CPSM, C.P.M., Chair of the Institute for Supply Management® (ISM®) Manufacturing Business Survey Committee:
“The August Manufacturing PMI® registered 47.6 percent, 1.2 percentage points higher than the 46.4 percent recorded in July. Regarding the overall economy, this figure indicates a ninth month of contraction after a 30-month period of expansion. The New Orders Index remained in contraction territory at 46.8 percent, 0.5 percentage point lower than the figure of 47.3 percent recorded in July. The Production Index reading of 50 percent is a 1.7-percentage point increase compared to July’s figure of 48.3 percent. The Prices Index registered 48.4 percent, up 5.8 percentage points compared to the July figure of 42.6 percent. The Backlog of Orders Index registered 44.1 percent, 1.3 percentage points higher than the July reading of 42.8 percent. The Employment Index registered 48.5 percent, up 4.1 percentage points from July’s reading of 44.4 percent."
emphasis added
Comments on August Employment Report
by Calculated Risk on 9/01/2023 09:12:00 AM
The headline jobs number in the August employment report was at expectations, however, employment for the previous two months was revised down by 110,000, combined. The participation rate increased, and the employment population ratio was unchanged, and the unemployment rate increased to 3.8%.
The increase in the unemployment rate was due to the increase in the participation rate as 736 thousand people jointed the labor force in August.
In August, the year-over-year employment change was 3.09 million jobs.
Prime (25 to 54 Years Old) Participation
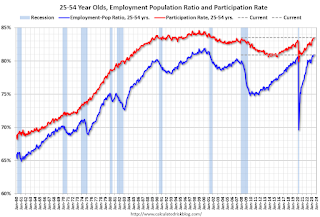 Since the overall participation rate is impacted by both cyclical (recession) and demographic (aging population, younger people staying in school) reasons, here is the employment-population ratio for the key working age group: 25 to 54 years old.
The 25 to 54 participation rate increased in August to 83.5% from 83.4% in July, and the 25 to 54 employment population ratio was unchanged at 80.9% from 80.9% the previous month.
Part Time for Economic Reasons
 From the BLS report:
These workers are included in the alternate measure of labor underutilization (U-6) that increased to 7.1% from 6.7% in the previous month. This is down from the record high in April 22.9% and up from the lowest level on record (seasonally adjusted) in December 2022 (6.5%). (This series started in 1994). This measure is close to the 7.0% level in February 2020 (pre-pandemic).
Unemployed over 26 Weeks
 This graph shows the number of workers unemployed for 27 weeks or more.
According to the BLS, there are 1.296 million workers who have been unemployed for more than 26 weeks and still want a job, down from 1.164 million the previous month.
This has been increasing recently and is above the pre-pandemic levels.
Summary:
The headline monthly jobs number was at consensus expectations; however, June and July payrolls were revised down by 110,000 combined. The unemployment rate increased as more people joined the labor force.
Leisure and hospitality gained 40 thousand jobs in August. At the beginning of the pandemic, in March and April of 2020, leisure and hospitality lost 8.2 million jobs, and are now down 290 thousand jobs since February 2020. So, leisure and hospitality has now added back about 96% all of the jobs lost in March and April 2020.
Construction employment increased 22 thousand and is now 385 thousand above the pre-pandemic level.
Manufacturing employment increased 16 thousand jobs and is now 212 thousand above the pre-pandemic level.
In August, the year-over-year employment change was 3.09 million jobs.
Prime (25 to 54 Years Old) Participation
 Since the overall participation rate is impacted by both cyclical (recession) and demographic (aging population, younger people staying in school) reasons, here is the employment-population ratio for the key working age group: 25 to 54 years old.
The 25 to 54 participation rate increased in August to 83.5% from 83.4% in July, and the 25 to 54 employment population ratio was unchanged at 80.9% from 80.9% the previous month.
Both are above the pre-pandemic levels and suggest all of the prime age workers have returned to the labor force.
Average Hourly Wages
 The graph shows the nominal year-over-year change in "Average Hourly Earnings" for all private employees from the Current Employment Statistics (CES).
Average Hourly Wages
 The graph shows the nominal year-over-year change in "Average Hourly Earnings" for all private employees from the Current Employment Statistics (CES).
 There was a huge increase at the beginning of the pandemic as lower paid employees were let go, and then the pandemic related spike reversed a year later.
Wage growth has trended down after peaking at 5.9% YoY in March 2022 and was at 4.3% YoY in August.
Wage growth has trended down after peaking at 5.9% YoY in March 2022 and was at 4.3% YoY in August.
Part Time for Economic Reasons
 From the BLS report:
"The number of persons employed part time for economic reasons, at 4.2 million, changed little in August. These individuals, who would have preferred full-time employment, were working part time because their hours had been reduced or they were unable to find full-time jobs."The number of persons working part time for economic reasons increased in August to 4.22 million from 4.00 million in July. This is below pre-recession levels.
These workers are included in the alternate measure of labor underutilization (U-6) that increased to 7.1% from 6.7% in the previous month. This is down from the record high in April 22.9% and up from the lowest level on record (seasonally adjusted) in December 2022 (6.5%). (This series started in 1994). This measure is close to the 7.0% level in February 2020 (pre-pandemic).
Unemployed over 26 Weeks
 This graph shows the number of workers unemployed for 27 weeks or more.
 According to the BLS, there are 1.296 million workers who have been unemployed for more than 26 weeks and still want a job, down from 1.164 million the previous month.
This has been increasing recently and is above the pre-pandemic levels.
Summary:
The headline monthly jobs number was at consensus expectations; however, June and July payrolls were revised down by 110,000 combined. The unemployment rate increased as more people joined the labor force.
Job growth has slowed to a somewhat more normal pace, up at a 2.3 million annual rate over the last 6 months.


