by Calculated Risk on 9/05/2023 03:48:00 PM
Tuesday, September 05, 2023
The Changing Mix of Light Vehicle Sales
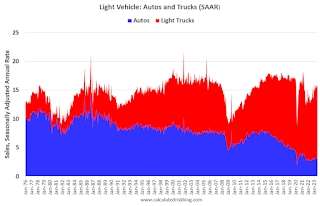
An update: The first graph below shows the mix of sales since 1976 (Blue is cars, Red is light trucks and SUVs) through August 2023.
Click on graph for larger image.
The mix has changed significantly. Back in 1976, most light vehicles were passenger cars - however passenger car sales have trended down over time.
Note that the big dips in sales are related to economic recessions (early '80s, early '90s, the Great Recession of 2007 through mid-2009 and the pandemic in 2020).
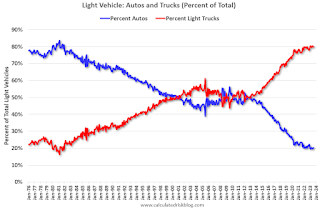
The second graph shows the percent of light vehicle sales between passenger cars and trucks / SUVs.
Heavy Truck Sales Solid in August, Up 2% YoY
by Calculated Risk on 9/05/2023 10:32:00 AM
This graph shows heavy truck sales since 1967 using data from the BEA. The dashed line is the August 2023 seasonally adjusted annual sales rate (SAAR).
Heavy truck sales really collapsed during the great recession, falling to a low of 180 thousand SAAR in May 2009. Then heavy truck sales increased to a new record high of 570 thousand SAAR in April 2019.
 Click on graph for larger image.
Note: "Heavy trucks - trucks more than 14,000 pounds gross vehicle weight."
Heavy truck sales declined sharply at the beginning of the pandemic, falling to a low of 308 thousand SAAR in May 2020.
As I noted on Friday, Vehicles Sales at 15.04 million SAAR in August; Up 14% YoY
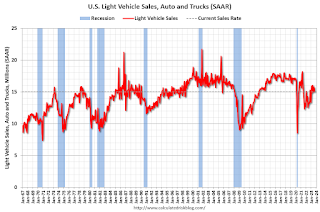 The second graph shows light vehicle sales since the BEA started keeping data in 1967. Vehicle sales were at 15.035 million SAAR in August, down from 15.75 million in July, and up 14% from 13.23 million in August 2022.
Lawler: Single Family Rent Trends at AMH and Invitation Homes
by Calculated Risk on 9/05/2023 08:28:00 AM
Today, in the Calculated Risk Real Estate Newsletter: Lawler: Single Family Rent Trends at AMH and Invitation Homes
A brief excerpt:
This article from housing economist Tom Lawler reviews some of the data included in my article last week Asking Rents Down 1.2% Year-over-year and adds some additional data from AMH and Invitation Homes.There is much more in the article. You can subscribe at https://calculatedrisk.substack.com/
...
Below is a table showing single-family rent trends at AMH (formerly American Homes 4 Rent) and Invitation Homes, two large institutional investors in SF rental homes.
Note that while rent growth has slowed at both companies over the last year, the slowdown in growth in actual rents paid is much less than that observed in most rent indexes.
Monday, September 04, 2023
Monday Night Futures
by Calculated Risk on 9/04/2023 06:20:00 PM
Weekend:
• Schedule for Week of September 3, 2023
Monday:
• At 8:00 AM ET, Corelogic House Price index for July
From CNBC: Pre-Market Data and Bloomberg futures S&P 500 futures and DOW futures are up slightly (fair value).
Oil prices were down over the last week with WTI futures at $85.90 per barrel and Brent at $89.00 per barrel. A year ago, WTI was at $87, and Brent was at $94 - so WTI oil prices are down slightly year-over-year.
Here is a graph from Gasbuddy.com for nationwide gasoline prices. Nationally prices are at $3.76 per gallon. A year ago, prices were at $3.76 per gallon, so gasoline prices are unchanged year-over-year.
Update: Lumber Prices Down 14% YoY
by Calculated Risk on 9/04/2023 01:10:00 PM
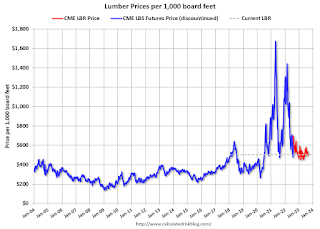
This graph shows CME random length framing futures through last August (blue), and the new physically-delivered Lumber Futures (LBR) contract starting in August 2022 (Red).
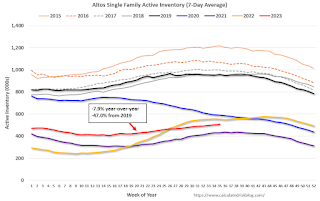
Housing September 4th Weekly Update: Inventory increased 1.1% Week-over-week; Down 7.9% Year-over-year
by Calculated Risk on 9/04/2023 08:15:00 AM
 Click on graph for larger image.
This inventory graph is courtesy of Altos Research.
Sunday, September 03, 2023
Hotels: Occupancy Rate Increased 0.4% Year-over-year
by Calculated Risk on 9/03/2023 08:21:00 AM
Following seasonal patterns, U.S. hotel performance declined from the previous week but showed positive comparisons year over year, according to CoStar’s latest data through 26 August. ...The following graph shows the seasonal pattern for the hotel occupancy rate using the four-week average.
20-26 August 2023 (percentage change from comparable week in 2022):
• Occupancy: 65.0% (+0.4%)
• Average daily rate (ADR): US$150.23 (+1.7%)
• Revenue per available room (RevPAR): US$97.62 (+2.1%)
emphasis added
 Click on graph for larger image.
The red line is for 2023, black is 2020, blue is the median, and dashed light blue is for 2022. Dashed purple is for 2018, the record year for hotel occupancy.
Saturday, September 02, 2023
Real Estate Newsletter Articles this Week: Case-Shiller: National House Price Index Unchanged year-over-year
by Calculated Risk on 9/02/2023 02:11:00 PM
At the Calculated Risk Real Estate Newsletter this week:
• Case-Shiller: National House Price Index Unchanged year-over-year in June
• Inflation Adjusted House Prices 3.9% Below Peak
• Asking Rents Down 1.2% Year-over-year
• Fannie Mae Single-Family Mortgage Serious Delinquency Rate Lowest since 2002
• Freddie Mac House Price Index Increased in July to New High; Up 2.9% Year-over-year Black Knight House Price Index Hits New High, but "Mixed signals"
This is usually published 4 to 6 times a week and provides more in-depth analysis of the housing market.
You can subscribe at https://calculatedrisk.substack.com/
Schedule for Week of September 3, 2023
by Calculated Risk on 9/02/2023 10:41:00 AM
This will be a light week for economic data. The key report is the July trade balance.
All US markets will be closed in observance of the Labor Day holiday.
8:00 AM ET: Corelogic House Price index for July
7:00 AM ET: The Mortgage Bankers Association (MBA) will release the results for the mortgage purchase applications index.
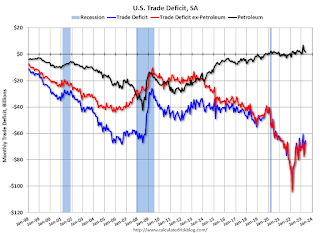 8:30 AM: Trade Balance report for July from the Census Bureau.
 This graph shows the U.S. trade deficit, with and without petroleum, through the most recent report. The blue line is the total deficit, and the black line is the petroleum deficit, and the red line is the trade deficit ex-petroleum products.
The consensus is for the U.S. trade deficit to be $65.85 billion in July, from $65.5 billion in June.
10:00 AM: the ISM Services Index for August. The consensus is for a reading of 52.6, down from 52.7.
2:00 PM: the Federal Reserve Beige Book, an informal review by the Federal Reserve Banks of current economic conditions in their Districts.
8:30 AM: The initial weekly unemployment claims report will be released.
12:00 PM: Q2 Flow of Funds Accounts of the United States from the Federal Reserve.
Friday, September 01, 2023
Sept 1st COVID Update: Deaths and Hospitalizations Increased
by Calculated Risk on 9/01/2023 08:19:00 PM
| COVID Metrics | ||||
|---|---|---|---|---|
| Now | Week Ago | Goal | ||
| Hospitalized2🚩 | 11,165 | 9,452 | ≤3,0001 | |
| Deaths per Week2🚩 | 641 | 616 | ≤3501 | |
| 1my goals to stop weekly posts, 2Weekly for Currently Hospitalized, and Deaths 🚩 Increasing number weekly for Hospitalized and Deaths ✅ Goal met. | ||||
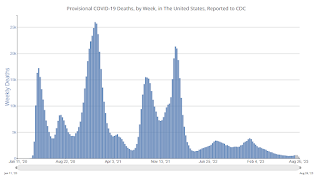 Click on graph for larger image.
This graph shows the weekly (columns) number of deaths reported.

