 RSS Feed
 by Calculated Risk on 9/06/2023 10:00:00 AM
Wednesday, September 06, 2023
ISM® Services Index Increases to 54.5% in August
(Posted with permission). The ISM® Services index was at 54.5%, up from 52.7% last month. The employment index increased to 54.7%, from 50.7%. Note: Above 50 indicates expansion, below 50 in contraction.
From the Institute for Supply Management: Services PMI® at 54.5% August 2023 Services ISM® Report On Business®
Economic activity in the services sector expanded in August for the eighth consecutive month as the Services PMI® registered 54.5 percent, say the nation's purchasing and supply executives in the latest Services ISM® Report On Business®. The sector has grown in 38 of the last 39 months, with the lone contraction in December of last year.The PMI was above expectations.
The report was issued today by Anthony Nieves, CPSM, C.P.M., A.P.P., CFPM, Chair of the Institute for Supply Management® (ISM®) Services Business Survey Committee: “In August, the Services PMI® registered 54.5 percent, 1.8 percentage points higher than July’s reading of 52.7 percent. The composite index indicated growth in August for the eighth consecutive month after a reading of 49.2 percent in December, which was the first contraction since June 2020 (45.4 percent). The Business Activity Index registered 57.3 percent, a 0.2-percentage point increase compared to the reading of 57.1 percent in July. The New Orders Index expanded in August for the eighth consecutive month after contracting in December for the first time since May 2020; the figure of 57.5 percent is 2.5 percentage points higher than the July reading of 55 percent.
emphasis added
Trade Deficit at $65.0 Billion in July
by Calculated Risk on 9/06/2023 08:30:00 AM
The Census Bureau and the Bureau of Economic Analysis reported:
The U.S. Census Bureau and the U.S. Bureau of Economic Analysis announced today that the goods and services deficit was $65.0 billion in July, up $1.3 billion from $63.7 billion in June, revised.
July exports were $251.7 billion, $3.9 billion more than June exports. July imports were $316.7 billion, $5.2 billion more than June imports.
emphasis added
 Click on graph for larger image.
Exports and imports increased in July.
Exports are down 3% year-over-year; imports are down 5% year-over-year.
Both imports and exports decreased sharply due to COVID-19 and then bounced back - and both have been decreasing recently.
The second graph shows the U.S. trade deficit, with and without petroleum.
 The blue line is the total deficit, and the black line is the petroleum deficit, and the red line is the trade deficit ex-petroleum products.
Note that net, exports of petroleum products are positive and have picked up.
The trade deficit with China decreased to $25.4 billion from $34.2 billion a year ago.
The trade deficit was slightly less than the consensus forecast.
MBA: Mortgage Applications Decreased in Weekly Survey; Purchase Applications Lowest in 28 Years
by Calculated Risk on 9/06/2023 07:00:00 AM
From the MBA: Mortgage Applications Decrease in Latest MBA Weekly Survey
Mortgage applications decreased 2.9 percent from one week earlier, according to data from the Mortgage Bankers Association’s (MBA) Weekly Mortgage Applications Survey for the week ending September 1, 2023.
The Market Composite Index, a measure of mortgage loan application volume, decreased 2.9 percent on a seasonally adjusted basis from one week earlier. On an unadjusted basis, the Index decreased 5 percent compared with the previous week. The Refinance Index decreased 5 percent from the previous week and was 30 percent lower than the same week one year ago. The seasonally adjusted Purchase Index decreased 2 percent from one week earlier. The unadjusted Purchase Index decreased 5 percent compared with the previous week and was 28 percent lower than the same week one year ago.
“Mortgage applications declined to the lowest level since December 1996, despite a drop in mortgage rates. Both purchase and refinance applications fell, with the purchase index hitting a 28-year low, as prospective buyers remain on the sidelines due to low housing inventory and elevated mortgage rates,” said Joel Kan, MBA’s Vice President and Deputy Chief Economist. “The 30-year fixed mortgage rate decreased to 7.21 percent last week, but rates remained more than a full percentage point higher than a year ago, despite mixed data on the health of the economy and signs of a cooling job market. The refinance index dropped to its lowest level since January 2023, driven by a 6 percent decline in conventional refinances.”
...
The average contract interest rate for 30-year fixed-rate mortgages with conforming loan balances ($726,200 or less) decreased to 7.21 percent from 7.31 percent, with points decreasing to 0.69 from 0.73 (including the origination fee) for 80 percent loan-to-value ratio (LTV) loans.
emphasis added
 Click on graph for larger image.
The first graph shows the MBA mortgage purchase index.
According to the MBA, purchase activity is down 28% year-over-year unadjusted.
Red is a four-week average (blue is weekly). This is the lowest level since 1995!

The second graph shows the refinance index since 1990.
With higher mortgage rates, the refinance index declined sharply in 2022 - and has mostly flat lined at a low level since then.
Tuesday, September 05, 2023
Wednesday: Trade Deficit, ISM Services, Beige Book
by Calculated Risk on 9/05/2023 08:39:00 PM
 From Matthew Graham at Mortgage News Daily: Mortgage Rates Jump Higher
Mortgage rates are noticeably higher to start the new week for most lenders although some lenders increased their costs nearly as much on Friday. Between the two business days (banks were closed on Monday), the average lender is up between 0.125% and 0.25% from Thursday afternoon. [30 year fixed 7.21%]Wednesday:
emphasis added
• At 7:00 AM ET, The Mortgage Bankers Association (MBA) will release the results for the mortgage purchase applications index.
• At 8:30 AM, Trade Balance report for July from the Census Bureau. The consensus is for the U.S. trade deficit to be $65.85 billion in July, from $65.5 billion in June.
• At 10:00 AM, the ISM Services Index for August. The consensus is for a reading of 52.6, down from 52.7.
• At 2:00 PM, the Federal Reserve Beige Book, an informal review by the Federal Reserve Banks of current economic conditions in their Districts.
The Changing Mix of Light Vehicle Sales
by Calculated Risk on 9/05/2023 03:48:00 PM
An update: The first graph below shows the mix of sales since 1976 (Blue is cars, Red is light trucks and SUVs) through August 2023.
Click on graph for larger image.
The mix has changed significantly. Back in 1976, most light vehicles were passenger cars - however passenger car sales have trended down over time.
Note that the big dips in sales are related to economic recessions (early '80s, early '90s, the Great Recession of 2007 through mid-2009 and the pandemic in 2020).
The second graph shows the percent of light vehicle sales between passenger cars and trucks / SUVs.
 Over time the mix has changed toward more and more light trucks and SUVs. Only when oil prices are high, does the trend slow or reverse.

Currently about 80% of light vehicle sales are light trucks or SUVs.
It is possible EVs will have an impact on the mix.
Heavy Truck Sales Solid in August, Up 2% YoY
by Calculated Risk on 9/05/2023 10:32:00 AM
The BEA released their estimate of vehicle sales for August today.
This graph shows heavy truck sales since 1967 using data from the BEA. The dashed line is the August 2023 seasonally adjusted annual sales rate (SAAR).
Heavy truck sales really collapsed during the great recession, falling to a low of 180 thousand SAAR in May 2009. Then heavy truck sales increased to a new record high of 570 thousand SAAR in April 2019.
 Click on graph for larger image.
Note: "Heavy trucks - trucks more than 14,000 pounds gross vehicle weight."
Heavy truck sales declined sharply at the beginning of the pandemic, falling to a low of 308 thousand SAAR in May 2020.
Heavy truck sales were at 512 thousand SAAR in August, down from 522 thousand in July, and up 2% from 504 thousand SAAR in August 2022.
Usually, heavy truck sales decline sharply prior to a recession. Sales were solid in August.
As I noted on Friday, Vehicles Sales at 15.04 million SAAR in August; Up 14% YoY
 The second graph shows light vehicle sales since the BEA started keeping data in 1967. Vehicle sales were at 15.035 million SAAR in August, down from 15.75 million in July, and up 14% from 13.23 million in August 2022.
Lawler: Single Family Rent Trends at AMH and Invitation Homes
by Calculated Risk on 9/05/2023 08:28:00 AM
Today, in the Calculated Risk Real Estate Newsletter: Lawler: Single Family Rent Trends at AMH and Invitation Homes
A brief excerpt:
This article from housing economist Tom Lawler reviews some of the data included in my article last week Asking Rents Down 1.2% Year-over-year and adds some additional data from AMH and Invitation Homes.There is much more in the article. You can subscribe at https://calculatedrisk.substack.com/
...
Below is a table showing single-family rent trends at AMH (formerly American Homes 4 Rent) and Invitation Homes, two large institutional investors in SF rental homes.
Note that while rent growth has slowed at both companies over the last year, the slowdown in growth in actual rents paid is much less than that observed in most rent indexes.

Monday, September 04, 2023
Monday Night Futures
by Calculated Risk on 9/04/2023 06:20:00 PM
Weekend:
• Schedule for Week of September 3, 2023
Monday:
• At 8:00 AM ET, Corelogic House Price index for July
From CNBC: Pre-Market Data and Bloomberg futures S&P 500 futures and DOW futures are up slightly (fair value).
Oil prices were down over the last week with WTI futures at $85.90 per barrel and Brent at $89.00 per barrel. A year ago, WTI was at $87, and Brent was at $94 - so WTI oil prices are down slightly year-over-year.
Here is a graph from Gasbuddy.com for nationwide gasoline prices. Nationally prices are at $3.76 per gallon. A year ago, prices were at $3.76 per gallon, so gasoline prices are unchanged year-over-year.
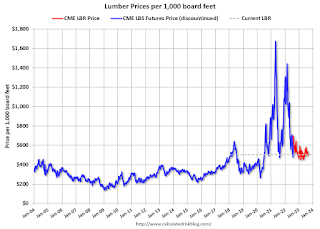
Update: Lumber Prices Down 14% YoY
by Calculated Risk on 9/04/2023 01:10:00 PM
Here is another monthly update on lumber prices.
Unfortunately, this impacts long term price comparisons since the new contract was priced about 24% higher than the old random length contract for the period both contracts were available.
This graph shows CME random length framing futures through last August (blue), and the new physically-delivered Lumber Futures (LBR) contract starting in August 2022 (Red).
 Click on graph for larger image.
We didn't see a significant runup in prices this Spring due to the housing slowdown.
This graph shows CME random length framing futures through last August (blue), and the new physically-delivered Lumber Futures (LBR) contract starting in August 2022 (Red).
LBR is currently at $503.00 per 1000 board feet, down 14% from $585.50 a year ago.
 Click on graph for larger image.
There is somewhat of a seasonal demand for lumber, and lumber prices usually peak in April or May.
We didn't see a significant runup in prices this Spring due to the housing slowdown.
Housing September 4th Weekly Update: Inventory increased 1.1% Week-over-week; Down 7.9% Year-over-year
by Calculated Risk on 9/04/2023 08:15:00 AM
Altos reports that active single-family inventory was up 1.1% week-over-week.
 Click on graph for larger image.
This inventory graph is courtesy of Altos Research.
As of September 1st, inventory was at 509 thousand (7-day average), compared to 503 thousand the prior week.
Year-to-date, inventory is up 3.7%. And inventory is up 25.5% from the seasonal bottom 20 weeks ago.

The red line is for 2023. The black line is for 2019. Note that inventory is up from the record low for the same week in 2021, but below last year and still well below normal levels.
Inventory was down 7.9% compared to the same week in 2022 (last week it was down 9.3%), and down 47.0% compared to the same week in 2019 (last week down 47.1%).
It appears same week inventory will be below 2022 levels for the remainder of the year. It is possible that inventory might be close to 2020 levels (dark blue line) by the end of the year.
Mike Simonsen discusses this data regularly on Youtube.


