by Calculated Risk on 9/07/2023 08:30:00 AM
Thursday, September 07, 2023
Weekly Initial Unemployment Claims Decrease to 216,000
The DOL reported:
In the week ending September 2, the advance figure for seasonally adjusted initial claims was 216,000, a decrease of 13,000 from the previous week's revised level. The previous week's level was revised up by 1,000 from 228,000 to 229,000. The 4-week moving average was 229,250, a decrease of 8,500 from the previous week's revised average. The previous week's average was revised up by 250 from 237,500 to 237,750.The following graph shows the 4-week moving average of weekly claims since 1971.
emphasis added
 Click on graph for larger image.
The dashed line on the graph is the current 4-week average. The four-week average of weekly unemployment claims decreased to 229,250.
The previous week was revised up.
Weekly claims were lower than the consensus forecast.
Wednesday, September 06, 2023
Thursday: Unemployment Claims
by Calculated Risk on 9/06/2023 08:18:00 PM
Thursday:
• At 8:30 AM: The initial weekly unemployment claims report will be released.
Fed's Beige Book: "Growth was modest during July and August"
by Calculated Risk on 9/06/2023 02:00:00 PM
Fed's Beige Book "This report was prepared at the Federal Reserve Bank of Kansas City based on information collected on or before August 28, 2023."
Contacts from most Districts indicated economic growth was modest during July and August. Consumer spending on tourism was stronger than expected, surging during what most contacts considered the last stage of pent-up demand for leisure travel from the pandemic era. But other retail spending continued to slow, especially on non-essential items. Some Districts highlighted reports suggesting consumers may have exhausted their savings and are relying more on borrowing to support spending. New auto sales did expand in many Districts, but contacts noted this had more to do with better availability of inventory rather than increased consumer demand. Manufacturing contacts in several Districts also noted that supply chain delays improved, and that they were better able to meet existing orders. New orders were stable or declined in most Districts, and backlogs shortened as demand for manufactured goods waned. One sector where supply did not become more available was single-family housing. Nearly all Districts reported the inventory of homes for sale remained constrained. Accordingly, new construction activity picked up for single-family housing. But multiple Districts noted that construction of affordable housing units was increasingly challenged by higher financing costs and rising insurance premiums. Bankers from different Districts had mixed experiences with growth in loan demand. Most indicated that consumer loan balances rose, and some Districts reported higher delinquencies on consumer credit lines. Agriculture conditions were somewhat mixed, but reports of drought and higher input costs were widespread. Energy activity was mostly unchanged during the final months of the summer.
Job growth was subdued across the nation. Though hiring slowed, most Districts indicated imbalances persisted in the labor market as the availability of skilled workers and the number of applicants remained constrained. Worker retention improved in several Districts, but only in certain sectors such as manufacturing and transportation. Many contacts suggested "the second half of the year will be different" when describing wage growth. Growth in labor cost pressures was elevated in most Districts, often exceeding expectations during the first half of the year. But nearly all Districts indicated businesses renewed their previously unfulfilled expectations that wage growth will slow broadly in the near term.
emphasis added
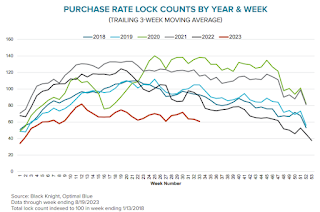
Black Knight Mortgage Monitor: Purchase Rate Locks "are now running 39% below pre-pandemic levels"
by Calculated Risk on 9/06/2023 11:30:00 AM
Today, in the Calculated Risk Real Estate Newsletter: Black Knight Mortgage Monitor: Purchase Rate Locks "are now running 39% below pre-pandemic levels"
A brief excerpt:
Black Knight on purchase rate locks:There is much more in the article. You can subscribe at https://calculatedrisk.substack.com/
• Rate locks have slumped in response to the highest mortgage rates in more than 20 years, as the 30-year conforming topped 7.27% and 30-year jumbo offerings climbed above 7.4% on August 21
• Purchase locks are now running 39% below pre-pandemic levels – among the steepest deficits we’ve seen so far this year
• With home affordability having its tightest point since the early 1980s, demand is likely to remain subdued in the near term
emphasis added
ISM® Services Index Increases to 54.5% in August
by Calculated Risk on 9/06/2023 10:00:00 AM
(Posted with permission). The ISM® Services index was at 54.5%, up from 52.7% last month. The employment index increased to 54.7%, from 50.7%. Note: Above 50 indicates expansion, below 50 in contraction.
From the Institute for Supply Management: Services PMI® at 54.5% August 2023 Services ISM® Report On Business®
Economic activity in the services sector expanded in August for the eighth consecutive month as the Services PMI® registered 54.5 percent, say the nation's purchasing and supply executives in the latest Services ISM® Report On Business®. The sector has grown in 38 of the last 39 months, with the lone contraction in December of last year.The PMI was above expectations.
The report was issued today by Anthony Nieves, CPSM, C.P.M., A.P.P., CFPM, Chair of the Institute for Supply Management® (ISM®) Services Business Survey Committee: “In August, the Services PMI® registered 54.5 percent, 1.8 percentage points higher than July’s reading of 52.7 percent. The composite index indicated growth in August for the eighth consecutive month after a reading of 49.2 percent in December, which was the first contraction since June 2020 (45.4 percent). The Business Activity Index registered 57.3 percent, a 0.2-percentage point increase compared to the reading of 57.1 percent in July. The New Orders Index expanded in August for the eighth consecutive month after contracting in December for the first time since May 2020; the figure of 57.5 percent is 2.5 percentage points higher than the July reading of 55 percent.
emphasis added
Trade Deficit at $65.0 Billion in July
by Calculated Risk on 9/06/2023 08:30:00 AM
The Census Bureau and the Bureau of Economic Analysis reported:
The U.S. Census Bureau and the U.S. Bureau of Economic Analysis announced today that the goods and services deficit was $65.0 billion in July, up $1.3 billion from $63.7 billion in June, revised.
July exports were $251.7 billion, $3.9 billion more than June exports. July imports were $316.7 billion, $5.2 billion more than June imports.
emphasis added
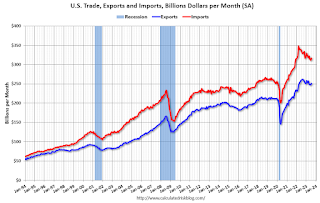 Click on graph for larger image.
Exports and imports increased in July.
Exports are down 3% year-over-year; imports are down 5% year-over-year.
Both imports and exports decreased sharply due to COVID-19 and then bounced back - and both have been decreasing recently.
The second graph shows the U.S. trade deficit, with and without petroleum.
 The blue line is the total deficit, and the black line is the petroleum deficit, and the red line is the trade deficit ex-petroleum products.
Note that net, exports of petroleum products are positive and have picked up.
The trade deficit with China decreased to $25.4 billion from $34.2 billion a year ago.
MBA: Mortgage Applications Decreased in Weekly Survey; Purchase Applications Lowest in 28 Years
by Calculated Risk on 9/06/2023 07:00:00 AM
From the MBA: Mortgage Applications Decrease in Latest MBA Weekly Survey
Mortgage applications decreased 2.9 percent from one week earlier, according to data from the Mortgage Bankers Association’s (MBA) Weekly Mortgage Applications Survey for the week ending September 1, 2023.
The Market Composite Index, a measure of mortgage loan application volume, decreased 2.9 percent on a seasonally adjusted basis from one week earlier. On an unadjusted basis, the Index decreased 5 percent compared with the previous week. The Refinance Index decreased 5 percent from the previous week and was 30 percent lower than the same week one year ago. The seasonally adjusted Purchase Index decreased 2 percent from one week earlier. The unadjusted Purchase Index decreased 5 percent compared with the previous week and was 28 percent lower than the same week one year ago.
“Mortgage applications declined to the lowest level since December 1996, despite a drop in mortgage rates. Both purchase and refinance applications fell, with the purchase index hitting a 28-year low, as prospective buyers remain on the sidelines due to low housing inventory and elevated mortgage rates,” said Joel Kan, MBA’s Vice President and Deputy Chief Economist. “The 30-year fixed mortgage rate decreased to 7.21 percent last week, but rates remained more than a full percentage point higher than a year ago, despite mixed data on the health of the economy and signs of a cooling job market. The refinance index dropped to its lowest level since January 2023, driven by a 6 percent decline in conventional refinances.”
...
The average contract interest rate for 30-year fixed-rate mortgages with conforming loan balances ($726,200 or less) decreased to 7.21 percent from 7.31 percent, with points decreasing to 0.69 from 0.73 (including the origination fee) for 80 percent loan-to-value ratio (LTV) loans.
emphasis added
 Click on graph for larger image.
The first graph shows the MBA mortgage purchase index.
According to the MBA, purchase activity is down 28% year-over-year unadjusted.

Tuesday, September 05, 2023
Wednesday: Trade Deficit, ISM Services, Beige Book
by Calculated Risk on 9/05/2023 08:39:00 PM
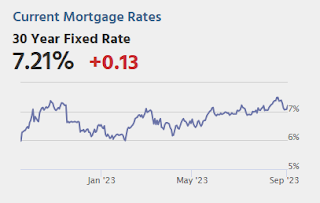
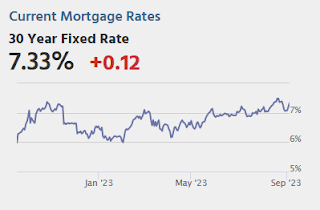
Mortgage rates are noticeably higher to start the new week for most lenders although some lenders increased their costs nearly as much on Friday. Between the two business days (banks were closed on Monday), the average lender is up between 0.125% and 0.25% from Thursday afternoon. [30 year fixed 7.21%]Wednesday:
emphasis added
• At 7:00 AM ET, The Mortgage Bankers Association (MBA) will release the results for the mortgage purchase applications index.
• At 8:30 AM, Trade Balance report for July from the Census Bureau. The consensus is for the U.S. trade deficit to be $65.85 billion in July, from $65.5 billion in June.
• At 10:00 AM, the ISM Services Index for August. The consensus is for a reading of 52.6, down from 52.7.
• At 2:00 PM, the Federal Reserve Beige Book, an informal review by the Federal Reserve Banks of current economic conditions in their Districts.
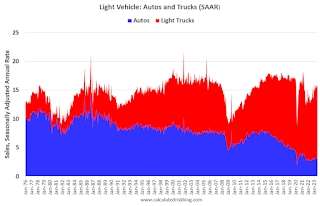
The Changing Mix of Light Vehicle Sales
by Calculated Risk on 9/05/2023 03:48:00 PM
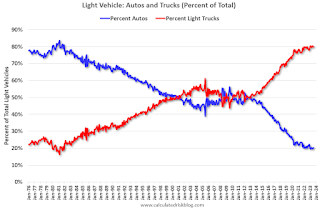
An update: The first graph below shows the mix of sales since 1976 (Blue is cars, Red is light trucks and SUVs) through August 2023.
Click on graph for larger image.
The mix has changed significantly. Back in 1976, most light vehicles were passenger cars - however passenger car sales have trended down over time.
Note that the big dips in sales are related to economic recessions (early '80s, early '90s, the Great Recession of 2007 through mid-2009 and the pandemic in 2020).
The second graph shows the percent of light vehicle sales between passenger cars and trucks / SUVs.
Heavy Truck Sales Solid in August, Up 2% YoY
by Calculated Risk on 9/05/2023 10:32:00 AM
This graph shows heavy truck sales since 1967 using data from the BEA. The dashed line is the August 2023 seasonally adjusted annual sales rate (SAAR).
Heavy truck sales really collapsed during the great recession, falling to a low of 180 thousand SAAR in May 2009. Then heavy truck sales increased to a new record high of 570 thousand SAAR in April 2019.
 Click on graph for larger image.
Note: "Heavy trucks - trucks more than 14,000 pounds gross vehicle weight."
Heavy truck sales declined sharply at the beginning of the pandemic, falling to a low of 308 thousand SAAR in May 2020.
As I noted on Friday, Vehicles Sales at 15.04 million SAAR in August; Up 14% YoY
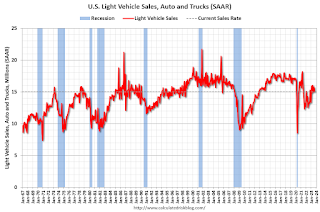 The second graph shows light vehicle sales since the BEA started keeping data in 1967. Vehicle sales were at 15.035 million SAAR in August, down from 15.75 million in July, and up 14% from 13.23 million in August 2022.
