 RSS Feed
 by Calculated Risk on 9/08/2023 09:10:00 AM
Friday, September 08, 2023
Wholesale Used Car Prices Increased 0.2% in August; Down 7.7% Year-over-year
From Manheim Consulting today: Wholesale Used-Vehicle Prices See Minimal Increase in August
Wholesale used-vehicle prices (on a mix, mileage, and seasonally adjusted basis) increased 0.2% in August from July. The Manheim Used Vehicle Value Index (MUVVI) rose to 212.2, down 7.7% from a year ago.
“August brought a stop to wholesale price declines, though it was only a small reversal of the larger magnitude declines so far this spring and early summer,” said Chris Frey, senior manager of Economic and Industry Insights for Cox Automotive. “Historically speaking, the monthly figure aligns with the 0.3% average we’ve seen since 1997. Sure, there were swings in August during the financial crisis, the COVID reopening period of 2020, and the 2022 doldrums; but this year, the performance looks more ordinary. Like last month’s note, the current Manheim Index level of 212.2 is barely above that of the 212.1 measure seen in August 2021. Used market conditions have been quite consistent for a few months and are not likely to change much, even with the larger push toward balance; sales are slightly stronger than expected, inventory remains tight, and prices are holding at levels around 6% below last year at the same time. These factors are expected to prevent any substantial decline in wholesale prices through year-end.”
The seasonal adjustment minimized August’s increase. The non-adjusted price change in August increased by 0.9% compared to July, moving the unadjusted average price down 7.5% year over year.
emphasis added
 Click on graph for larger image.
This index from Manheim Consulting is based on all completed sales transactions at Manheim’s U.S. auctions.
The Manheim index suggests used car prices increased slightly in August (seasonally adjusted) and were down 7.7% year-over-year (YoY).
CoreLogic: 1.11 million Homeowners with Negative Equity in Q2 2023
by Calculated Risk on 9/08/2023 08:11:00 AM
From CoreLogic: CoreLogic: Home Equity Increases From Winter to Spring, Reducing Underwater Properties in Q2
CoreLogic® ... today released the Homeowner Equity Report (HER) for the second quarter of 2023. The report shows that U.S. homeowners with mortgages (which account for roughly 63% of all properties) saw home equity decrease by 1.7% year over year, representing a collective loss of $287.6 billion, and an average loss of $8,300 per borrower since the second quarter of 2022.The above graph is from CoreLogic and compares Q2 2023 to Q1 2023 equity distribution by LTV. There are still a few properties with LTV over 125%. But most homeowners have a significant amount of equity.
However, U.S. homeowners with mortgages gained on average $13,900 quarter over quarter, amounting to a collective increase of $806 billion – or a 5.2% gain – in home equity. And while borrowers in the West continued to experience the largest year-over-year equity losses, homeowners in states like Hawaii, California and Washington still have the most accumulated equity due to the pace of appreciation over the past decade.
“While U.S. home equity is now lower than its peak in the second quarter of 2022, owners are in a better position than they were six months ago, when prices bottomed out,” said Selma Hepp, chief economist for CoreLogic. “The 5% overall increase in home prices since February means that the average U.S. homeowner has gained almost $14,000 compared with the previous quarter, a significant improvement for borrowers who bought when prices peaked in the spring of 2022.”
“Also, while more borrowers are underwater compared with one year ago,” Hepp continued, “they are not necessarily concentrated in markets that have seen the largest price declines, as negative equity also depends on the down payment. Natural disasters and related risks also play a substantial role in home equity changes.”
Negative equity, also referred to as underwater or upside-down mortgages, applies to borrowers who owe more on their mortgages than their homes are currently worth. As of the second quarter of 2023, the quarterly and annual changes in negative equity were:
Click on graph for larger image.
• Quarterly change: From the first quarter of 2023 to the second quarter of 2023, the total number of mortgaged homes in negative equity decreased by 6%, to 1.11 million homes or 2% of all mortgaged properties.
• Annual change: From the second quarter of 2022 to the second quarter of 2023, the total number of homes in negative equity increased by 4% from 1.06 million homes or 1.9% of all mortgaged properties.
emphasis added

 This is a very different picture than at the start of the housing bust when many homeowners had little equity.
The second graph is from a 2011 CoreLogic report and shows a large number of homeowners with negative equity - even as house prices were nearing a bottom!
On a year-over-year basis, the number of homeowners with negative equity has increased from 1.06 million to 1.11 million.
On a year-over-year basis, the number of homeowners with negative equity has increased from 1.06 million to 1.11 million.
Thursday, September 07, 2023
Friday: Q2 Flow of Funds
by Calculated Risk on 9/07/2023 08:48:00 PM
 Note: Mortgage rates are from MortgageNewsDaily.com and are for top tier scenarios.
Thursday:
• At 12:00 PM ET, Q2 Flow of Funds Accounts of the United States from the Federal Reserve.
Realtor.com Reports Weekly Active Inventory Down 5% YoY; New Listings Down 8.5% YoY
by Calculated Risk on 9/07/2023 03:56:00 PM
Realtor.com has monthly and weekly data on the existing home market. Here is their weekly report from Sabrina Speianu and Danielle Hale: Weekly Housing Trends View — Data Week Ending Sep 2, 2023
• Active inventory declined, with for-sale homes lagging behind year ago levels by 5.2%..
This past week marked the 11th consecutive decline in the number of homes actively for sale compared to the prior year, however the gap narrowed slightly compared to the previous week’s -5.9% figure. With inventory continuing to remain constrained, the pending and existing home sales pace has consistently hovered around a low level in recent months as high mortgage rates and home prices drive sellers and buyers to put plans to move on-hold.
• New listings–a measure of sellers putting homes up for sale–were down again this week, by 8.5% from one year ago..
For the past 61 weeks, there have been fewer newly listed homes compared to the same time one year ago. In July and August, this gap shrank from more than 20% lower to around 8% lower. While the number of newly listed homes increased from July to August (which is not typical in this season), new home listings have once again begun to decline as is expected heading into September. This past week, newly listed homes were down 8.5% compared to a year ago and this gap may have re-stabilized at this level.
 Here is a graph of the year-over-year change in inventory according to realtor.com.
 Inventory was down 5.2% year-over-year - this was the eleventh consecutive week with a YoY decrease following 58 consecutive weeks with a YoY increase in inventory.
Inventory is still up from the record lows in the 2nd half of 2021 and early 2022, and it is unlikely we will see new record lows by this measure this year.
1st Look at Local Housing Markets in August
by Calculated Risk on 9/07/2023 11:56:00 AM
Today, in the Calculated Risk Real Estate Newsletter: 1st Look at Local Housing Markets in August
A brief excerpt:
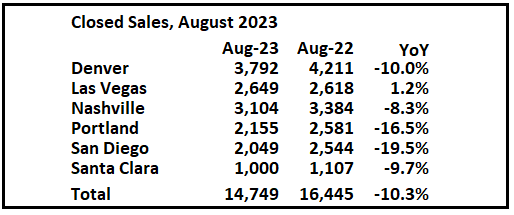
This is the first look at several early reporting local markets in August. I’m tracking about 40 local housing markets in the US. Some of the 40 markets are states, and some are metropolitan areas. I’ll update these tables throughout the month as additional data is released.There is much more in the article. You can subscribe at https://calculatedrisk.substack.com/
Closed sales in August were mostly for contracts signed in June and July. Since 30-year fixed mortgage rates were in the 6.7% range in June, and 6.8% in July, compared to the mid-5% range the previous year, closed sales were down year-over-year in August.
...
In August, sales in these markets were down 10.3%. In July, these same markets were down 11.8% YoY Not Seasonally Adjusted (NSA).
This is a slightly smaller YoY decline NSA than in July for these early reporting markets. Note that there were the same number of selling days each year in August 2022 and August 2023. ... This early data suggests the August existing home sales report will show another significant YoY decline - and probably close to the July sales rate of 4.07 million (SAAR) - and the 24th consecutive month with a YoY decline in sales.
This was just several early reporting markets. Many more local markets to come!
FDIC: Number of Problem Banks Unchanged in Q2 2023
by Calculated Risk on 9/07/2023 11:23:00 AM
The FDIC released the Quarterly Banking Profile for Q2 2023:
Reports from 4,645 commercial banks and savings institutions insured by the Federal Deposit Insurance Corporation (FDIC) reflect aggregate net income of $70.8 billion in second quarter 2023. Though second-quarter net income decreased by $9.0 billion (11.3 percent) from first quarter 2023, after excluding the effects on acquirers‘ incomes of their acquisition of three failed banks in 2023, quarter-over-quarter net income would have been roughly flat for the second consecutive quarter. Declines in noninterest income, reflecting the accounting treatment of the acquisition of three failed institutions, lower net interest income, and higher provision expenses were the drivers of the decline in net income. These and other financial results for second quarter 2023 are included in the FDIC‘s latest Quarterly Banking Profile released today.
...
Asset Quality Metrics Remained Favorable Despite Modest Deterioration: Loans that were 90 days or more past due or in nonaccrual status (i.e., noncurrent loans) increased to 0.76 percent of total loans, up 1 basis point from the prior quarter. Noncurrent nonfarm, nonresidential commercial real estate loan balances drove the increase in the noncurrent rate. Net charge-offs as a ratio of total loans increased 7 basis points from the prior quarter and 25 basis points from a year prior to 0.48 percent. The industry’s net charge-off rate is now equal to its pre-pandemic average.
emphasis added
 Click on graph for larger image.
The FDIC reported the number of problem banks was unchanged at 43.
The number of FDIC-insured institutions declined from 4,672 in first quarter to 4,645 this quarter. During the quarter, two banks opened, one bank failed, and 27 institutions merged. In addition, one bank failed during the third quarter and did not file a second quarter 2023 Call Report. The number of banks on the FDIC’s “Problem Bank List” remained unchanged at 43. Total assets of problem banks decreased from $58.0 billion to $46.0 billionThis graph from the FDIC shows the number of problem banks and assets at problem institutions.
Note: The number of assets for problem banks increased significantly back in 2018 when Deutsche Bank Trust Company Americas was added to the list. An even larger unknown bank was added to the list in Q4 2021, and - since problem assets dropped sharply last year - that bank is now off the problem list.
Weekly Initial Unemployment Claims Decrease to 216,000
by Calculated Risk on 9/07/2023 08:30:00 AM
The DOL reported:
In the week ending September 2, the advance figure for seasonally adjusted initial claims was 216,000, a decrease of 13,000 from the previous week's revised level. The previous week's level was revised up by 1,000 from 228,000 to 229,000. The 4-week moving average was 229,250, a decrease of 8,500 from the previous week's revised average. The previous week's average was revised up by 250 from 237,500 to 237,750.The following graph shows the 4-week moving average of weekly claims since 1971.
emphasis added
 Click on graph for larger image.
The dashed line on the graph is the current 4-week average. The four-week average of weekly unemployment claims decreased to 229,250.
The previous week was revised up.
Weekly claims were lower than the consensus forecast.
Wednesday, September 06, 2023
Thursday: Unemployment Claims
by Calculated Risk on 9/06/2023 08:18:00 PM
 Note: Mortgage rates are from MortgageNewsDaily.com and are for top tier scenarios.
Thursday:
• At 8:30 AM: The initial weekly unemployment claims report will be released.
Fed's Beige Book: "Growth was modest during July and August"
by Calculated Risk on 9/06/2023 02:00:00 PM
Fed's Beige Book "This report was prepared at the Federal Reserve Bank of Kansas City based on information collected on or before August 28, 2023."
Contacts from most Districts indicated economic growth was modest during July and August. Consumer spending on tourism was stronger than expected, surging during what most contacts considered the last stage of pent-up demand for leisure travel from the pandemic era. But other retail spending continued to slow, especially on non-essential items. Some Districts highlighted reports suggesting consumers may have exhausted their savings and are relying more on borrowing to support spending. New auto sales did expand in many Districts, but contacts noted this had more to do with better availability of inventory rather than increased consumer demand. Manufacturing contacts in several Districts also noted that supply chain delays improved, and that they were better able to meet existing orders. New orders were stable or declined in most Districts, and backlogs shortened as demand for manufactured goods waned. One sector where supply did not become more available was single-family housing. Nearly all Districts reported the inventory of homes for sale remained constrained. Accordingly, new construction activity picked up for single-family housing. But multiple Districts noted that construction of affordable housing units was increasingly challenged by higher financing costs and rising insurance premiums. Bankers from different Districts had mixed experiences with growth in loan demand. Most indicated that consumer loan balances rose, and some Districts reported higher delinquencies on consumer credit lines. Agriculture conditions were somewhat mixed, but reports of drought and higher input costs were widespread. Energy activity was mostly unchanged during the final months of the summer.
Job growth was subdued across the nation. Though hiring slowed, most Districts indicated imbalances persisted in the labor market as the availability of skilled workers and the number of applicants remained constrained. Worker retention improved in several Districts, but only in certain sectors such as manufacturing and transportation. Many contacts suggested "the second half of the year will be different" when describing wage growth. Growth in labor cost pressures was elevated in most Districts, often exceeding expectations during the first half of the year. But nearly all Districts indicated businesses renewed their previously unfulfilled expectations that wage growth will slow broadly in the near term.
emphasis added
Black Knight Mortgage Monitor: Purchase Rate Locks "are now running 39% below pre-pandemic levels"
by Calculated Risk on 9/06/2023 11:30:00 AM
Today, in the Calculated Risk Real Estate Newsletter: Black Knight Mortgage Monitor: Purchase Rate Locks "are now running 39% below pre-pandemic levels"
A brief excerpt:
Black Knight on purchase rate locks:There is much more in the article. You can subscribe at https://calculatedrisk.substack.com/
• Rate locks have slumped in response to the highest mortgage rates in more than 20 years, as the 30-year conforming topped 7.27% and 30-year jumbo offerings climbed above 7.4% on August 21
• Purchase locks are now running 39% below pre-pandemic levels – among the steepest deficits we’ve seen so far this year
• With home affordability having its tightest point since the early 1980s, demand is likely to remain subdued in the near term
emphasis added


