 RSS Feed
 by Calculated Risk on 9/13/2023 08:55:00 AM
Wednesday, September 13, 2023
YoY Measures of Inflation: Services, Goods and Shelter
Here are a few measures of inflation:
The first graph is the one Fed Chair Powell had mentioned earlier when services less rent of shelter was up 7.6% year-over-year. This has fallen sharply and is now up 3.1% YoY.
 Click on graph for larger image.
This graph shows the YoY price change for Services and Services less rent of shelter through July 2023.
Services were up 5.4% YoY as of August 2023, down from 5.7% YoY in July.
Services less rent of shelter was up 3.1% YoY in August, down from 3.3% YoY in July.
Services less rent of shelter was up 3.1% YoY in August, down from 3.3% YoY in July.
Earlier this year, a key question was: Would services ex-shelter inflation be persistent, or would it follow a similar pattern as goods? This is a topic I discussed in Pandemic Economics, Housing and Monetary Policy: Part 2.
 The second graph shows that goods prices started to increase year-over-year (YoY) in 2020 and accelerated in 2021 due to both strong demand and supply chain disruptions.
 The second graph shows that goods prices started to increase year-over-year (YoY) in 2020 and accelerated in 2021 due to both strong demand and supply chain disruptions.
Durables were at -2.0% YoY as of August 2023, down from -1.4% YoY in July.
Commodities less food and energy commodities were up 0.4% YoY in August, down from 0.9% YoY in July.
Commodities less food and energy commodities were up 0.4% YoY in August, down from 0.9% YoY in July.
Goods inflation was transitory.
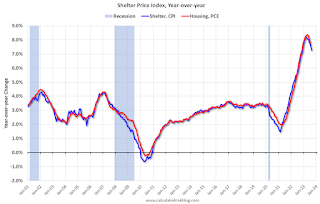 Here is a graph of the year-over-year change in shelter from the CPI report (through August) and housing from the PCE report (through July 2023)
Shelter was up 7.2% year-over-year in August, down from 7.7% in July. Housing (PCE) was up 7.8% YoY in July, down from 8.0% in June.
The BLS noted this morning: "The index for gasoline was the largest contributor to the monthly all items increase, accounting for over half of the increase. Also contributing to the August monthly increase was continued advancement in the shelter index, which rose for the 40th consecutive month."
BLS: CPI increased 0.6% in August; Core CPI increased 0.3%
by Calculated Risk on 9/13/2023 08:32:00 AM
The Consumer Price Index for All Urban Consumers (CPI-U) rose 0.6 percent in August on a seasonally adjusted basis, after increasing 0.2 percent in July, the U.S. Bureau of Labor Statistics reported today. Over the last 12 months, the all items index increased 3.7 percent before seasonal adjustment.CPI and core CPI were close to expectations. I'll post a graph later today after the Cleveland Fed releases the median and trimmed-mean CPI.
The index for gasoline was the largest contributor to the monthly all items increase, accounting for over half of the increase. Also contributing to the August monthly increase was continued advancement in the shelter index, which rose for the 40th consecutive month. The energy index rose 5.6 percent in August as all the major energy component indexes increased. The food index increased 0.2 percent in August, as it did in July. The index for food at home increased 0.2 percent over the month while the index for food away from home rose 0.3 percent in August.
The index for all items less food and energy rose 0.3 percent in August, following a 0.2-percent increase in July. Indexes which increased in August include rent, owners' equivalent rent, motor vehicle insurance, medical care, and personal care. The indexes for lodging away from home, used cars and trucks, and recreation were among those that decreased over the month.
The all items index increased 3.7 percent for the 12 months ending August, a larger increase than the 3.2-percent increase for the 12 months ending in July. The all items less food and energy index rose 4.3 percent over the last 12 months. The energy index decreased 3.6 percent for the 12 months ending August, and the food index increased 4.3 percent over the last year.
emphasis added
MBA: Mortgage Applications Decreased in Weekly Survey
by Calculated Risk on 9/13/2023 07:00:00 AM
From the MBA: Mortgage Applications Decrease in Latest MBA Weekly Survey
Mortgage applications decreased 0.8 percent from one week earlier, according to data from the Mortgage Bankers Association’s (MBA) Weekly Mortgage Applications Survey for the week ending September 8, 2023. This week’s results included an adjustment for the Labor Day holiday.
The Market Composite Index, a measure of mortgage loan application volume, decreased 0.8 percent on a seasonally adjusted basis from one week earlier. On an unadjusted basis, the Index decreased 12 percent compared with the previous week. The Refinance Index decreased 5 percent from the previous week and was 31 percent lower than the same week one year ago. The seasonally adjusted Purchase Index increased 1 percent from one week earlier. The unadjusted Purchase Index decreased 11 percent compared with the previous week and was 27 percent lower than the same week one year ago.
“Mortgage applications decreased for the seventh time in eight weeks, reaching the lowest level since 1996. Last week’s decline was driven by a 5 percent drop in refinance applications to the weakest reading since January 2023,” said Joel Kan, MBA’s Vice President and Deputy Chief Economist. “The 30-year fixed mortgage rate increased to 7.27 percent last week and was 40 basis points higher than where it was in late July. Purchase applications increased over the week despite the increase in rates, pushed higher by a 2 percent gain in conventional loans. Given how high rates are right now, there continues to be minimal refinance activity and a reduced incentive for homeowners to sell and buy a new home at a higher rate.”
...
The average contract interest rate for 30-year fixed-rate mortgages with conforming loan balances ($726,200 or less) increased to 7.27 percent from 7.21 percent, with points increasing to 0.72 from 0.69 (including the origination fee) for 80 percent loan-to-value ratio (LTV) loans.
emphasis added
 Click on graph for larger image.
The first graph shows the MBA mortgage purchase index.
According to the MBA, purchase activity is down 27% year-over-year unadjusted.
Red is a four-week average (blue is weekly).

The second graph shows the refinance index since 1990.
With higher mortgage rates, the refinance index declined sharply in 2022 - and has mostly flat lined at a low level since then.
Tuesday, September 12, 2023
Wednesday: CPI
by Calculated Risk on 9/12/2023 07:51:00 PM
 From Matthew Graham at Mortgage News Daily: Mortgage Rates Jump Higher
Mortgage rates are noticeably higher to start the new week for most lenders although some lenders increased their costs nearly as much on Friday. Between the two business days (banks were closed on Monday), the average lender is up between 0.125% and 0.25% from Thursday afternoon. [30 year fixed 7.21%]Wednesday:
emphasis added
• At 7:00 AM ET, The Mortgage Bankers Association (MBA) will release the results for the mortgage purchase applications index.
• At 8:30 AM, The Consumer Price Index for August from the BLS. The consensus is for a 0.6% increase in CPI, and a 0.2% increase in core CPI. The consensus is for CPI to be up 3.6% year-over-year and core CPI to be up 4.3% YoY.
CPI Preview and Owners' equivalent rent
by Calculated Risk on 9/12/2023 02:31:00 PM
Tomorrow the BLS will release inflation data for August. The consensus is for a 0.6% increase in CPI, and a 0.2% increase in core CPI. The consensus is for CPI to be up 3.6% year-over-year (up from 3.3% in July) and core CPI to be up 4.3% YoY (down from 4.7% in July).
Here is a preview from Goldman Sachs economists Manuel Abecasis and Spencer Hill:
We expect a 0.24% increase in August core CPI (vs. 0.2% consensus), corresponding to a year-over-year rate of 4.30% (vs. 4.3% consensus). We expect a 0.63% increase in August headline CPI (vs. 0.6% consensus), which corresponds to a year-over-year rate of 3.58% (vs. 3.6% consensus).A key component to watch is the year-over-year change in shelter. Asking rents are mostly flat year-over-year, but renewals are still increasing - and this has kept the BLS measure of shelter inflation from falling faster.
Last month the BLS noted: "The index for shelter was by far the largest contributor to the monthly all items increase, accounting for over 90 percent of the increase, with the index for motor vehicle insurance also contributing."
 Here is a graph of the year-over-year change in shelter from the CPI report (through July) and housing from the PCE report (through June 2023)
Shelter was up 7.7% year-over-year in July, down from 7.8% in June. Housing (PCE) was up 8.0% YoY in June, down from 8.3% in May.
2nd Look at Local Housing Markets in August
by Calculated Risk on 9/12/2023 10:08:00 AM
Today, in the Calculated Risk Real Estate Newsletter: 2nd Look at Local Housing Markets in August
A brief excerpt:
This is the second look at local markets in August. I’m tracking a sample of about 40 local housing markets in the US. Some of the 40 markets are states, and some are metropolitan areas. I’ll update these tables throughout the month as additional data is released.There is much more in the article. You can subscribe at https://calculatedrisk.substack.com/
Closed sales in August were mostly for contracts signed in June and July. Since 30-year fixed mortgage rates were in the 6.7% range in June, and 6.8% in July, compared to the mid-5% range the previous year, closed sales were down year-over-year in August.
...
In August, sales in these markets were down 12.8%. In July, these same markets were down 13.7% YoY Not Seasonally Adjusted (NSA).
This is a slightly smaller YoY decline NSA than in July for these early reporting markets. Note that there were the same number of selling days each year in August 2022 and August 2023. ... This early data suggests the August existing home sales report will show another significant YoY decline - and probably close to or below the July sales rate of 4.07 million (SAAR) - and the 24th consecutive month with a YoY decline in sales.
Many more local markets to come!

CoreLogic: US Annual Home Price Growth Rate Increased in July
by Calculated Risk on 9/12/2023 08:12:00 AM
Notes: This CoreLogic House Price Index report is for July. The recent Case-Shiller index release was for June. The CoreLogic HPI is a three-month weighted average and is not seasonally adjusted (NSA).
From CoreLogic: Annual US Home Price Growth Rebounds in July, CoreLogic Reports
• U.S. home price gains moved up to 2.5% year over year in July, marking the 138th consecutive month of annual growth.This index was up 1.6% YoY in June.
• Eleven states saw home price declines on an annual basis in July, ranging from -5.7% in Idaho to -0.3% in California.
• The median sales price for a U.S. single-family home was $375,000 in July, led by California ($700,000), the District of Columbia ($670,000) and Massachusetts ($590,000).
...
U.S. home price gains rebounded year over year in July, increasing to 2.5% and following two months of 1.6% annual gains. The annual reacceleration reflects six consecutive monthly gains, which drove prices about 5% higher compared to the February bottom. The 11 states that saw home price declines were all in the West, but since many of those markets continue to struggle with inventory shortages, that trend may be short-lived, and recent buyer competition will cause prices to heat up again. CoreLogic projects that all states that saw year-over-year losses in July will begin posting gains by October of this year.
“Annual home price growth regained momentum in July, which mostly reflects strong appreciation from earlier this year,” said Selma Hepp, chief economist for CoreLogic. “That said, high mortgage rates have slowed additional price surges, with monthly increases returning to regular seasonal averages. In other words, home prices are still growing but are in line with historic seasonal expectations.”
“Nevertheless, the projection of prolonged higher mortgage rates has dampened price forecasts over the next year, particularly in less-affordable markets,” Hepp continued. “But as there is still an extreme inventory shortage in the Western U.S., home prices in some of those markets should see relatively more upward pressure.”
emphasis added
Monday, September 11, 2023
Tuesday: Corelogic House Price index
by Calculated Risk on 9/11/2023 08:14:00 PM
 From Matthew Graham at Mortgage News Daily: Will CPI Matter Again?
At times over the past 2 years, the Consumer Price Index (CPI) has been the most important economic report on any given month and has had a bigger impact on bonds than the mighty jobs report. ...Tuesday:
If this week's numbers are far enough from forecasts, there's no reason to doubt CPI's market moving power--especially with the uptick in energy costs and the Fed on deck next week. [30 year fixed 7.30%]
emphasis added
• At 6:00 AM ET, NFIB Small Business Optimism Index for August.
• At 8:00 AM, Corelogic House Price index for July
Q2 Update: Delinquencies, Foreclosures and REO
by Calculated Risk on 9/11/2023 12:33:00 PM
Today, in the Calculated Risk Real Estate Newsletter: Q2 Update: Delinquencies, Foreclosures and REO
A brief excerpt:
In 2021, I pointed out that with the end of the foreclosure moratoriums, combined with the expiration of a large number of forbearance plans, we would see an increase in REOs in late 2022 and into 2023. And there was a slight increase.There is much more in the article. You can subscribe at https://calculatedrisk.substack.com/
However, I argued this would NOT lead to a surge in foreclosures and significantly impact house prices (as happened following the housing bubble) since lending has been solid and most homeowners have substantial equity in their homes.
...
Here is some data from the FHFA’s National Mortgage Database showing the distribution of interest rates on closed-end, fixed-rate 1-4 family mortgages outstanding at the end of each quarter since Q1 2013 through Q1 2023 (Q2 2023 data will be released in a few weeks).
This shows the surge in the percent of loans under 3%, and also under 4%, starting in early 2020 as mortgage rates declined sharply during the pandemic. Currently 23.3% of loans are under 3%, 61.3% are under 4%, and 81.2% are under 5%.
With substantial equity, and low mortgage rates (mostly at a fixed rates), few homeowners will have financial difficulties.

Leading Index for Commercial Real Estate Decreased in August
by Calculated Risk on 9/11/2023 10:19:00 AM
From Dodge Data Analytics: Dodge Momentum Index Drops 6.5% in August
The Dodge Momentum Index (DMI), issued by Dodge Construction Network, declined 6.5% in August to 178.0 (2000=100) from the revised July reading of 190.3. Over the month, the commercial component of the DMI fell 1.6%, while the institutional component fell 14.8%.
“Overall activity remains above historical norms, but weaker market fundamentals continue to undermine planning growth,” said Sarah Martin, associate director of forecasting for Dodge Construction Network. “It’s likely that the full year of tightening lending standards and high interest rates has begun to affect institutional planning, which has otherwise been resistant to these market headwinds. Also, planning in the sector continues to revert from the strong spike in activity back in May. As we move into the final four months of 2023, both commercial and institutional planning will continue to be constrained.”
August saw a deceleration in education, healthcare and amusement planning activity, fueling the sizable decline in the institutional sector. Meanwhile, stronger hotel planning offset weaker office activity, causing a milder regression in the commercial segment over August. Year over year, the DMI remained 4% higher than in August 2022. The commercial and institutional components were up 3% and 7%, respectively.
...
The DMI is a monthly measure of the initial report for nonresidential building projects in planning, shown to lead construction spending for nonresidential buildings by a full year.
emphasis added
 Click on graph for larger image.
This graph shows the Dodge Momentum Index since 2002. The index was at 178.0 in August, down from 190.3 the previous month.
According to Dodge, this index leads "construction spending for nonresidential buildings by a full year". This index suggests some slowdown towards the end of 2023 and in 2024.
Commercial construction is a lagging economic indicator.


