 RSS Feed
 by Calculated Risk on 9/14/2023 07:36:00 PM
Thursday, September 14, 2023
Friday: Industrial Production, NY Fed Mfg
 Note: Mortgage rates are from MortgageNewsDaily.com and are for top tier scenarios.
Friday:
• At 8:30 AM ET, The New York Fed Empire State manufacturing survey for September. The consensus is for a reading of -10.7, up from -19.0.
• At 9:15 AM, The Fed will release Industrial Production and Capacity Utilization for August. The consensus is for a 0.1% increase in Industrial Production, and for Capacity Utilization to be unchanged at 79.3%.
• At 10:00 AM, University of Michigan's Consumer sentiment index (Preliminary for September).
Realtor.com Reports Weekly Active Inventory Down 5.1% YoY; New Listings Down 7.1% YoY
by Calculated Risk on 9/14/2023 02:55:00 PM
Realtor.com has monthly and weekly data on the existing home market. Here is their weekly report from Hannah Jones: Weekly Housing Trends View — Data Week Ending Sep 9, 2023
• Active inventory declined, with for-sale homes lagging behind year ago levels by 5.1%. This past week marked the 12th consecutive decline in the number of homes actively for sale compared to the prior year, however the gap narrowed compared to the previous week’s -5.2% figure.
• New listings–a measure of sellers putting homes up for sale–were down again this week, by 7.1% from one year ago. For the past 62 weeks, there have been fewer newly listed homes compared to the same time one year ago. The annual gap has generally narrowed since late June as the data lapped last year’s lower listing trend. While the number of newly listed homes increased from July to August (which is not typical in this season), new home listings have declined as is typical in the first two weeks in September.
 Here is a graph of the year-over-year change in inventory according to realtor.com.
 Inventory was down 5.1% year-over-year - this was the twelfth consecutive week with a YoY decrease following 58 consecutive weeks with a YoY increase in inventory.
Inventory is still up from the record lows in the 2nd half of 2021 and early 2022, and it is unlikely we will see new record lows by this measure this year.
Part 2: Current State of the Housing Market; Overview for mid-September
by Calculated Risk on 9/14/2023 12:00:00 PM
Today, in the Calculated Risk Real Estate Newsletter: Part 2: Current State of the Housing Market; Overview for mid-September
A brief excerpt:
Yesterday, in Part 1: Current State of the Housing Market; Overview for mid-September I reviewed home inventory and sales.There is much more in the article. You can subscribe at https://calculatedrisk.substack.com/
...
Most measures of house prices have shown an increase in prices over the last several months, and a key question I discussed in July is Will house prices decline further later this year? I will revisit this question soon.
Other measures of house prices suggest prices will be up YoY over the next few months in the Case-Shiller index. The NAR reported median prices were up 1.9% YoY in July, up from a 0.9% YoY decline in June. Black Knight reported prices were up 2.3% YoY in July to new all-time highs, and Freddie Mac reported house prices were up 2.9% YoY in July, up from 1.6% YoY in June - and also to new all-time highs.
Here is a comparison of year-over-year change in the FMHPI, median house prices from the NAR, and the Case-Shiller National index.
The FMHPI and the NAR median prices appear to be leading indicators for Case-Shiller. Based on recent monthly data, and the FMHPI, the YoY change in the Case-Shiller index will turn positive in the report for July.

Retail Sales Increased 0.6% in August
by Calculated Risk on 9/14/2023 08:35:00 AM
On a monthly basis, retail sales were up 0.6% from July to August (seasonally adjusted), and sales were up 2.5 percent from August 2022.
From the Census Bureau report:
Advance estimates of U.S. retail and food services sales for August 2023, adjusted for seasonal variation and holiday and trading-day differences, but not for price changes, were $697.6 billion, up 0.6 percent from the previous month, and up 2.5 percent (±0.7 percent) above August 2022. ... The June 2023 to July 2023 percent change was revised from up 0.7 percent to up 0.5 percent.
emphasis added
 Click on graph for larger image.
This graph shows retail sales since 1992. This is monthly retail sales and food service, seasonally adjusted (total and ex-gasoline).
Retail sales ex-gasoline were up 0.2% in August.
The second graph shows the year-over-year change in retail sales and food service (ex-gasoline) since 1993.
Retail and Food service sales, ex-gasoline, increased by 3.8% on a YoY basis.
 The increase in sales in August was well above expectations, however, sales in June and July were revised down.
Weekly Initial Unemployment Claims Increase to 220,000
by Calculated Risk on 9/14/2023 08:30:00 AM
The DOL reported:
In the week ending September 9, the advance figure for seasonally adjusted initial claims was 220,000, an increase of 3,000 from the previous week's revised level. The previous week's level was revised up by 1,000 from 216,000 to 217,000. The 4-week moving average was 224,500, a decrease of 5,000 from the previous week's revised average. The previous week's average was revised up by 250 from 229,250 to 229,500.The following graph shows the 4-week moving average of weekly claims since 1971.
emphasis added
 Click on graph for larger image.
The dashed line on the graph is the current 4-week average. The four-week average of weekly unemployment claims decreased to 224,500.
The previous week was revised up.
Weekly claims were higher than the consensus forecast.
Wednesday, September 13, 2023
Thursday: Retail Sales, Unemployment Claims, PPI
by Calculated Risk on 9/13/2023 08:00:00 PM
 Note: Mortgage rates are from MortgageNewsDaily.com and are for top tier scenarios.
Thursday:
• At 8:30 AM ET, The initial weekly unemployment claims report will be released. The consensus is for 212 thousand initial claims, down from 216 thousand last week.
• Also at 8:30 AM, Retail sales for August will be released. The consensus is for a 0.1% increase in retail sales.
• Also at 8:30 AM, The Producer Price Index for August from the BLS. The consensus is for a 0.4% decrease in PPI, and a 0.2% increase in core PPI.
Early Look at 2024 Cost-Of-Living Adjustments and Maximum Contribution Base
by Calculated Risk on 9/13/2023 02:43:00 PM
The BLS reported on this morning:
The Consumer Price Index for Urban Wage Earners and Clerical Workers (CPI-W) increased 3.4 percent over the last 12 months to an index level of 301.551 (1982-84=100). For the month, the index increased 0.6 percent prior to seasonal adjustment.CPI-W is the index that is used to calculate the Cost-Of-Living Adjustments (COLA). The calculation dates have changed over time (see Cost-of-Living Adjustments), but the current calculation uses the average CPI-W for the three months in Q3 (July, August, September) and compares to the average for the highest previous average of Q3 months. Note: this is not the headline CPI-U and is not seasonally adjusted (NSA).
• In 2022, the Q3 average of CPI-W was 291.901.
The 2022 Q3 average was the highest previous Q3 average, so we only have to compare Q3 this year to last year.
 Click on graph for larger image.
This graph shows CPI-W since January 2000. The red lines are the Q3 average of CPI-W for each year.
Note: The year labeled is for the calculation, and the adjustment is effective for December of that year (received by beneficiaries in January of the following year).
CPI-W was up 3.4% year-over-year in August, and although this is early - we need the data for September - my early guess is COLA will probably be close to 3.2% this year, the smallest increase since 1.3% in 2021.
Contribution and Benefit Base
The contribution base will be adjusted using the National Average Wage Index. This is based on a one-year lag. The National Average Wage Index is not available for 2022 yet, wages increased solidly in 2022. If wages increased 5% in 2022, then the contribution base next year will increase to around $168,200 in 2024, from the current $160,200.
Remember - this is an early look. What matters is average CPI-W, NSA, for all three months in Q3 (July, August and September).
Part 1: Current State of the Housing Market; Overview for mid-September
by Calculated Risk on 9/13/2023 11:36:00 AM
Today, in the Calculated Risk Real Estate Newsletter: Part 1: Current State of the Housing Market; Overview for mid-September
A brief excerpt:
Interestingly, new home inventory is close to a record percentage of total inventory. This graph uses Not Seasonally Adjusted (NSA) existing home inventory from the National Association of Realtors® (NAR) and new home inventory from the Census Bureau (only completed and under construction inventory).There is much more in the article. You can subscribe at https://calculatedrisk.substack.com/
Note: Mark Fleming, Chief Economist at First American pointed this out in March.
It took a number of years following the housing bust for new home inventory to return to the pre-bubble percent of total inventory. Then, with the pandemic, existing home inventory collapsed and now the percent of new homes is close to 23% of total for sale inventory. The lack of existing home inventory, and few distressed sales, has been a positive for homebuilders.

YoY Measures of Inflation: Services, Goods and Shelter
by Calculated Risk on 9/13/2023 08:55:00 AM
Here are a few measures of inflation:
The first graph is the one Fed Chair Powell had mentioned earlier when services less rent of shelter was up 7.6% year-over-year. This has fallen sharply and is now up 3.1% YoY.
 Click on graph for larger image.
This graph shows the YoY price change for Services and Services less rent of shelter through July 2023.
Services were up 5.4% YoY as of August 2023, down from 5.7% YoY in July.
Services less rent of shelter was up 3.1% YoY in August, down from 3.3% YoY in July.
Services less rent of shelter was up 3.1% YoY in August, down from 3.3% YoY in July.
Earlier this year, a key question was: Would services ex-shelter inflation be persistent, or would it follow a similar pattern as goods? This is a topic I discussed in Pandemic Economics, Housing and Monetary Policy: Part 2.
 The second graph shows that goods prices started to increase year-over-year (YoY) in 2020 and accelerated in 2021 due to both strong demand and supply chain disruptions.
 The second graph shows that goods prices started to increase year-over-year (YoY) in 2020 and accelerated in 2021 due to both strong demand and supply chain disruptions.
Durables were at -2.0% YoY as of August 2023, down from -1.4% YoY in July.
Commodities less food and energy commodities were up 0.4% YoY in August, down from 0.9% YoY in July.
Commodities less food and energy commodities were up 0.4% YoY in August, down from 0.9% YoY in July.
Goods inflation was transitory.
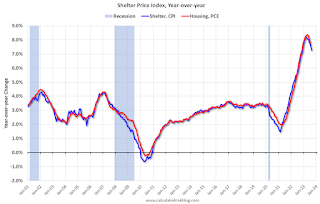 Here is a graph of the year-over-year change in shelter from the CPI report (through August) and housing from the PCE report (through July 2023)
Shelter was up 7.2% year-over-year in August, down from 7.7% in July. Housing (PCE) was up 7.8% YoY in July, down from 8.0% in June.
The BLS noted this morning: "The index for gasoline was the largest contributor to the monthly all items increase, accounting for over half of the increase. Also contributing to the August monthly increase was continued advancement in the shelter index, which rose for the 40th consecutive month."
BLS: CPI increased 0.6% in August; Core CPI increased 0.3%
by Calculated Risk on 9/13/2023 08:32:00 AM
The Consumer Price Index for All Urban Consumers (CPI-U) rose 0.6 percent in August on a seasonally adjusted basis, after increasing 0.2 percent in July, the U.S. Bureau of Labor Statistics reported today. Over the last 12 months, the all items index increased 3.7 percent before seasonal adjustment.CPI and core CPI were close to expectations. I'll post a graph later today after the Cleveland Fed releases the median and trimmed-mean CPI.
The index for gasoline was the largest contributor to the monthly all items increase, accounting for over half of the increase. Also contributing to the August monthly increase was continued advancement in the shelter index, which rose for the 40th consecutive month. The energy index rose 5.6 percent in August as all the major energy component indexes increased. The food index increased 0.2 percent in August, as it did in July. The index for food at home increased 0.2 percent over the month while the index for food away from home rose 0.3 percent in August.
The index for all items less food and energy rose 0.3 percent in August, following a 0.2-percent increase in July. Indexes which increased in August include rent, owners' equivalent rent, motor vehicle insurance, medical care, and personal care. The indexes for lodging away from home, used cars and trucks, and recreation were among those that decreased over the month.
The all items index increased 3.7 percent for the 12 months ending August, a larger increase than the 3.2-percent increase for the 12 months ending in July. The all items less food and energy index rose 4.3 percent over the last 12 months. The energy index decreased 3.6 percent for the 12 months ending August, and the food index increased 4.3 percent over the last year.
emphasis added


