 RSS Feed
 by Calculated Risk on 9/25/2023 12:19:00 PM
Monday, September 25, 2023
Update on Four High Frequency Indicators
I stopped the weekly updates of high frequency indicators at the end of 2022.
Here is a late September look at four indicators:
The TSA is providing daily travel numbers.
This data is as of September 24th.
 Click on graph for larger image.
This data shows the 7-day average of daily total traveler throughput from the TSA for 2019 (Light Blue), 2020 (Black), 2021 (Blue), 2022 (Orange) and 2023 (Red).
The dashed line is the percent of 2019 for the seven-day average.
The 7-day average is above the level for the same week in 2019 (103.4% of 2019). (Dashed line)
Air travel - as a percent of 2019 - is tracking above pre-pandemic levels.
----- Movie Tickets: Box Office Mojo -----
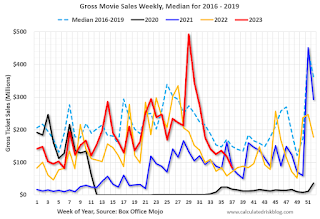 This data shows domestic box office for each week and the median for the years 2016 through 2019 (dashed light blue).
 This data shows domestic box office for each week and the median for the years 2016 through 2019 (dashed light blue).
 Black is 2020, Blue is 2021 and Red is 2022.
The data is from BoxOfficeMojo through September 21st.
Note that the data is usually noisy week-to-week and depends on when blockbusters are released.
Movie ticket sales (dollars) have mostly been running below the pre-pandemic levels.
Note that the data is usually noisy week-to-week and depends on when blockbusters are released.
Movie ticket sales (dollars) have mostly been running below the pre-pandemic levels.
 This graph shows the seasonal pattern for the hotel occupancy rate using the four-week average.
 The red line is for 2023, black is 2020, blue is the median, and dashed light blue is for 2022. Dashed purple is for 2018, the record year for hotel occupancy.
This data is through September 16th. The occupancy rate was down 2.2% compared to the same week in 2022.
The 4-week average of the occupancy rate is tracking just below last year, and slightly above the median rate for the period 2000 through 2022 (Blue).
Notes: Y-axis doesn't start at zero to better show the seasonal change.
Notes: Y-axis doesn't start at zero to better show the seasonal change.

This graph, based on weekly data from the U.S. Energy Information Administration (EIA) shows gasoline supplied compared to the same week of 2019.
Blue is for 2020. Purple is for 2021, and Orange is for 2022, and Red is for 2023.
Gasoline supplied in 2023 is running about 5% below 2019 levels.
Housing September 25th Weekly Update: Inventory increased 1.8% Week-over-week; Down 5.2% Year-over-year
by Calculated Risk on 9/25/2023 08:21:00 AM
Altos reports that active single-family inventory was up 1.8% week-over-week.
 Click on graph for larger image.
This inventory graph is courtesy of Altos Research.
As of September 22nd, inventory was at 527 thousand (7-day average), compared to 519 thousand the prior week.
Year-to-date, inventory is up 7.6%. And inventory is up 30.2% from the seasonal bottom 23 weeks ago.

The red line is for 2023. The black line is for 2019. Note that inventory is up from the record low for the same week in 2021, but below last year and still well below normal levels.
Inventory was down 5.2% compared to the same week in 2022 (last week it was down 6.1%), and down 44.7% compared to the same week in 2019 (last week down 45.6%).
In 2022, inventory didn't peak until late October, and it appears same week inventory will be below 2022 levels for the remainder of the year - depending on when inventory peaks seasonally this year!
It seems likely that inventory will be close to or above 2020 levels (dark blue line) by the end of the year.
Mike Simonsen discusses this data regularly on Youtube.
Sunday, September 24, 2023
Sunday Night Futures
by Calculated Risk on 9/24/2023 06:12:00 PM
Weekend:
• Schedule for Week of September 24, 2023
Monday:
• At 8:30 AM ET, Chicago Fed National Activity Index for August. This is a composite index of other data.
• At 10:30 AM, Dallas Fed Survey of Manufacturing Activity for September.
From CNBC: Pre-Market Data and Bloomberg futures S&P 500 futures are up 5 and DOW futures are up 40 (fair value).
Oil prices were down slightly over the last week with WTI futures at $90.03 per barrel and Brent at $93.27 per barrel. A year ago, WTI was at $79, and Brent was at $84 - so WTI oil prices are up 14% year-over-year.
Here is a graph from Gasbuddy.com for nationwide gasoline prices. Nationally prices are at $3.81 per gallon. A year ago, prices were at $3.83 per gallon, so gasoline prices are mostly unchanged year-over-year.
The Top Ten Job Streaks: Current Streak is in 8th Place
by Calculated Risk on 9/24/2023 09:51:00 AM
For fun:
Through August 2023, the employment report indicated positive job growth for 32 consecutive months, putting the current streak in 8th place of the longest job streaks in US history (since 1939).
The UAW strike will not impact the September employment report since it started on September 15th, so it seems likely the job streak will move into a tie for 5th place with the next report (if it is actually released - threatened by another shutdown).
| Headline Jobs, Top 10 Streaks | |
|---|---|
| Year Ended | Streak, Months |
| 2019 | 100 |
| 1990 | 48 |
| 2007 | 46 |
| 1979 | 45 |
| 1943 | 33 |
| 1986 | 33 |
| 2000 | 33 |
| 20231 | 32 |
| 1967 | 29 |
| 1995 | 25 |
| 1Currrent Streak | |
Saturday, September 23, 2023
Real Estate Newsletter Articles this Week: Near Record Number of Multi-Family Housing Units Under Construction
by Calculated Risk on 9/23/2023 02:11:00 PM
At the Calculated Risk Real Estate Newsletter this week:
• August Housing Starts: Near Record Number of Multi-Family Housing Units Under Construction
• NAR: Existing-Home Sales Decreased to 4.04 million SAAR in August
• Lawler: Early Read on Existing Home Sales in August and Some New Household/Housing Stock Data
• 4th Look at Local Housing Markets in August
This is usually published 4 to 6 times a week and provides more in-depth analysis of the housing market.
You can subscribe at https://calculatedrisk.substack.com/
Schedule for Week of September 24, 2023
by Calculated Risk on 9/23/2023 08:11:00 AM
The key reports this week are August New Home sales, the third estimate of Q2 GDP, Personal Income and Outlays for August, and Case-Shiller house prices for July.
For manufacturing, the Richmond, Dallas and Kansas City Fed manufacturing surveys will be released this week.
8:30 AM ET: Chicago Fed National Activity Index for August. This is a composite index of other data.
10:30 AM: Dallas Fed Survey of Manufacturing Activity for September.
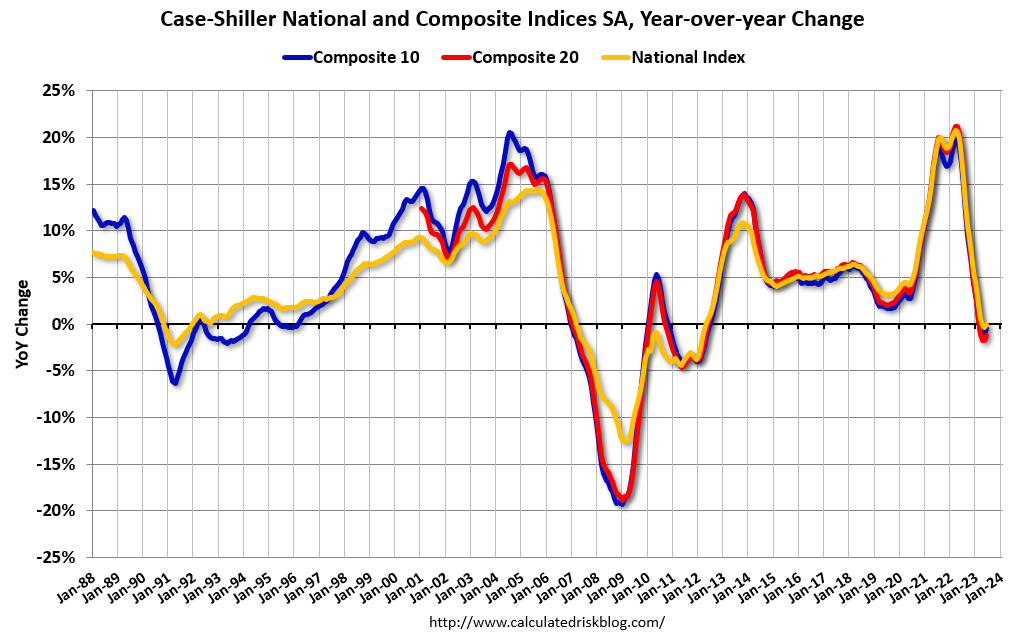 9:00 AM: S&P/Case-Shiller House Price Index for July.
This graph shows the year-over-year change in the seasonally adjusted National Index, Composite 10 and Composite 20 indexes through the most recent report (the Composite 20 was started in January 2000).
The consensus is for a 0.5% year-over-year increase in the National index for July.
9:00 AM: FHFA House Price Index for July. This was originally a GSE only repeat sales, however there is also an expanded index.
 10:00 AM: New Home Sales for August from the Census Bureau.
 This graph shows New Home Sales since 1963. The dashed line is the sales rate for last month.
The consensus is for 700 thousand SAAR, down from 714 thousand in July.
10:00 AM: the Richmond Fed manufacturing survey for September.
7:00 AM ET: The Mortgage Bankers Association (MBA) will release the results for the mortgage purchase applications index.
8:30 AM: Durable Goods Orders for August from the Census Bureau. The consensus is for a 1.6% decrease in durable goods orders.
8:30 AM: The initial weekly unemployment claims report will be released. The consensus is for 206 thousand initial claims, up from 201 thousand last week.
8:30 AM: Gross Domestic Product, 2nd Quarter 2023 (Third Estimate), and Corporate Profits (Revised) The consensus is that real GDP increased 2.2% annualized in Q2, up from the second estimate of 2.1%.
10:00 AM: Pending Home Sales Index for August. The consensus is 1.0% decrease in the index.
11:00 AM: the Kansas City Fed manufacturing survey for September. This is the last of the regional surveys for September.
4:00 PM: Conversation with Fed Chair Powell: A Teacher Town Hall Meeting "Federal Reserve Board Chair Jerome H. Powell will host a town hall with educators in Washington, D.C. and nationwide via webcast ... The Chair will respond to questions from the in-person audience and virtual participants from across the country."
8:30 AM: Personal Income and Outlays, August 2023. The consensus is for a 0.5% increase in personal income, and for a 0.4% increase in personal spending. And for the Core PCE price index to increase 0.2%. PCE prices are expected to be up 3.5% YoY, and core PCE prices up 3.9% YoY.
9:45 AM: Chicago Purchasing Managers Index for September. The consensus is for a reading of 47.6, down from 48.7 in August.
10:00 AM: University of Michigan's Consumer sentiment index (Final for September). The consensus is for a reading of 67.7.
Friday, September 22, 2023
Sept 22nd COVID Update: Deaths and Hospitalizations Increased
by Calculated Risk on 9/22/2023 07:17:00 PM
 Note: Mortgage rates are from MortgageNewsDaily.com and are for top tier scenarios.
Due to changes at the CDC, weekly cases are no longer updated.
For deaths, I'm currently using 3 weeks ago for "now", since the most recent two weeks will be revised significantly.
Recently hospitalizations have tripled from a low of 5,150 in June 2023. Hospitalizations are increasing, but far below the peak of 150,000 in January 2022.
| COVID Metrics | ||||
|---|---|---|---|---|
| Now | Week Ago | Goal | ||
| Hospitalized2🚩 | 16,050 | 14,681 | ≤3,0001 | |
| Deaths per Week2🚩 | 1,005 | 959 | ≤3501 | |
| 1my goals to stop weekly posts, 2Weekly for Currently Hospitalized, and Deaths 🚩 Increasing number weekly for Hospitalized and Deaths ✅ Goal met. | ||||
 Click on graph for larger image.
This graph shows the weekly (columns) number of deaths reported.
Weekly deaths have more than doubled from a low of 469 in early July. Weekly deaths are increasing, but far below the weekly peak of 26,000 in January 2021.
Black Knight: Mortgage Delinquency Rate Decreased Slightly in August
by Calculated Risk on 9/22/2023 01:43:00 PM
From Black Knight: Black Knight’s First Look: Mortgage Performance Remains Strong, but Slowing Improvement Suggests Delinquencies May Be Nearing Cycle Lows
• At 3.17%, the U.S. delinquency rate improved by 4 basis points in August and is nearly a full percentage point below its 2015-2019 same-month averageAccording to Black Knight's First Look report, the percent of loans delinquent decreased 1.2% in August compared to July and decreased 0.8% year-over-year.
• However, steady slowing in the annual rate of improvement -- from -40% in early 2022 to -0.8% as of August – suggests delinquency rates may be nearing cycle lows
• Serious delinquencies (90+ days past due) continued to improve, falling 20K from July to 448K – still the lowest level since June 2006 – and down 151K (-25%) year over year
• Early-stage delinquencies, on the other hand, continued to trend upward, with both 30- and 60-day late populations inching up by 2K, marking the third consecutive monthly increase
• The number of loans in active foreclosure declined to 215K – the lowest level since March 2022 following the end of moratoria on such actions – and is down 68K (-24%) from pre-pandemic February 2020
• August’s 31.9K (+21.3% month over month) foreclosure starts – equating to 6.8% of serious delinquencies – were still 21% below August 2019 pre-pandemic levels
• While 6.9K foreclosure sales marked a 13% increase from July, volumes remain at roughly half pre-pandemic levels
• Prepayment activity (SMM) inched up to 0.53% under pressure from seasonal home buying patterns, while interest rates north of 7% continue to hold prepayment speeds at historically low levels
emphasis added
Black Knight reported the U.S. mortgage delinquency rate (loans 30 or more days past due, but not in foreclosure) was 3.17% in August, down from 3.21% the previous month.
The percent of loans in the foreclosure process decreased in August to 0.41%, from 0.42% the previous month.
The number of delinquent properties, but not in foreclosure, is up 12,000 properties year-over-year, and the number of properties in the foreclosure process is down 14,000 properties year-over-year.
| Black Knight: Percent Loans Delinquent and in Foreclosure Process | ||||
|---|---|---|---|---|
| August 2023 | July 2023 | |||
| Delinquent | 3.17% | 3.21% | ||
| In Foreclosure | 0.41% | 0.42% | ||
| Number of properties: | ||||
| Number of properties that are delinquent, but not in foreclosure: | 1,684,000 | 1,700,000 | ||
| Number of properties in foreclosure pre-sale inventory: | 215,000 | 220,000 | ||
| Total Properties | 1,899,000 | 1,919,000 | ||
Philly Fed: State Coincident Indexes Increased in 40 States in August (3-Month Basis)
by Calculated Risk on 9/22/2023 12:59:00 PM
From the Philly Fed:
The Federal Reserve Bank of Philadelphia has released the coincident indexes for the 50 states for August 2023. Over the past three months, the indexes increased in 40 states, decreased in eight states, and remained stable in two, for a three-month diffusion index of 64. Additionally, in the past month, the indexes increased in 30 states, decreased in 13 states, and remained stable in seven, for a one-month diffusion index of 34. For comparison purposes, the Philadelphia Fed has also developed a similar coincident index for the entire United States. The Philadelphia Fed’s U.S. index increased 0.6 percent over the past three months and 0.1 percent in August.Note: These are coincident indexes constructed from state employment data. An explanation from the Philly Fed:
emphasis added
The coincident indexes combine four state-level indicators to summarize current economic conditions in a single statistic. The four state-level variables in each coincident index are nonfarm payroll employment, average hours worked in manufacturing by production workers, the unemployment rate, and wage and salary disbursements deflated by the consumer price index (U.S. city average). The trend for each state’s index is set to the trend of its gross domestic product (GDP), so long-term growth in the state’s index matches long-term growth in its GDP.
 Click on map for larger image.
Here is a map of the three-month change in the Philly Fed state coincident indicators. This map was all red during the worst of the Pandemic and also at the worst of the Great Recession.
The map is mostly positive on a three-month basis.
Source: Philly Fed.
 And here is a graph is of the number of states with one month increasing activity according to the Philly Fed.
 This graph includes states with minor increases (the Philly Fed lists as unchanged).
In August, 33 states had increasing activity including minor increases.
In August, 33 states had increasing activity including minor increases.
September Vehicle Sales Forecast: 15.4 million SAAR, Up Sharply YoY
by Calculated Risk on 9/22/2023 09:56:00 AM
From WardsAuto: September U.S. Light-Vehicle Sales Heading for Strong Year-Over-Year Gain Despite Strike Impact (pay content). Brief excerpt:
The possibility in September that other automakers will benefit much from buyers defecting from the Detroit 3 brands is negligible. The vehicles currently impacted by shutdowns either are products with high brand loyalty, in segments dominated by the three strike-impacted manufacturers or have plenty of inventory.
emphasis added
 Click on graph for larger image.
This graph shows actual sales from the BEA (Blue), and Wards forecast for September (Red).
On a seasonally adjusted annual rate basis, the Wards forecast of 15.4 million SAAR, would be up 2% from last month, and up 13% from a year ago.
Vehicle sales are usually a transmission mechanism for Federal Open Market Committee (FOMC) policy, although far behind housing. This time vehicle sales were more suppressed by supply chain issues and have picked up recently.


