by Calculated Risk on 9/28/2023 07:53:00 PM
Thursday, September 28, 2023
Friday: Personal Income and Outlays
Friday:
• At 8:30 AM ET, Personal Income and Outlays, August 2023. The consensus is for a 0.5% increase in personal income, and for a 0.4% increase in personal spending. And for the Core PCE price index to increase 0.2%. PCE prices are expected to be up 3.5% YoY, and core PCE prices up 3.9% YoY.
• At 9:45 AM, Chicago Purchasing Managers Index for September. The consensus is for a reading of 47.6, down from 48.7 in August.
• At 10:00 AM, University of Michigan's Consumer sentiment index (Final for September). The consensus is for a reading of 67.7.
Asking Rents Down 1.2% Year-over-year
by Calculated Risk on 9/28/2023 02:45:00 PM
Today, in the Calculated Risk Real Estate Newsletter: Asking Rents Down 1.2% Year-over-year
A brief excerpt:
Tracking rents is important for understanding the dynamics of the housing market. For example, the sharp increase in rents helped me deduce that there was a surge in household formation in 2021 (See from September 2021: Household Formation Drives Housing Demand).There is much more in the article. You can subscribe at https://calculatedrisk.substack.com/
The surge in household formation has been confirmed (mostly due to work-from-home), and this led to the supposition that household formation would slow sharply in 2023 (mostly confirmed) and that asking rents might decrease in 2023 on a year-over-year basis (now negative year-over-year).
Recent data suggests household formation has slowed sharply and asking rents are declining year-over-year.
...
Here is a graph of the year-over-year (YoY) change for these measures since January 2015. Most of these measures are through August 2023, except CoreLogic is through July and Apartment List is through September 2023.
...
With slow household formation, more supply coming on the market and a rising vacancy rate, rents will be under pressure all year. See: Forecast: Multifamily Starts will Decline Sharply
Realtor.com Reports Weekly Active Inventory Down 3.7% YoY; New Listings Down 7.5% YoY
by Calculated Risk on 9/28/2023 01:00:00 PM
Realtor.com has monthly and weekly data on the existing home market. Here is their weekly report from Jiayi Xu: Weekly Housing Trends View — Data Week Ending Sep 23, 2023
• Active inventory declined, with for-sale homes lagging behind year ago levels by 3.7%. During the past week, we observed the 14th successive drop in the number of homes available for sale when compared to the previous year. This decline showed a slight improvement compared to the previous week’s -4.4% figure.
• New listings–a measure of sellers putting homes up for sale–were down again this week, by 7.5% from one year ago. Over the past 64 weeks, we’ve consistently seen a decline in the number of newly listed homes compared to the same period one year ago. While this gap in new listings was gradually narrowed over the past few weeks, in the most recent week, the decrease in newly listed homes was -7.5% compared to the previous year, lower from the -6.0% decline in the week prior.
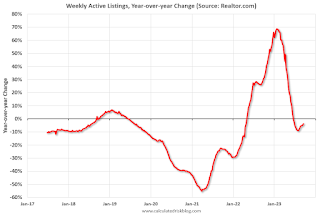 Here is a graph of the year-over-year change in inventory according to realtor.com.
 Inventory was down 3.7% year-over-year - this was the fourteenth consecutive week with a YoY decrease following 58 consecutive weeks with a YoY increase in inventory.
NAR: Pending Home Sales Decrease 7.1% in August; Down 18.7% Year-over-year
by Calculated Risk on 9/28/2023 10:00:00 AM
From the NAR: Pending Home Sales Tumbled 7.1% in August
Pending home sales slid 7.1% in August, according to the National Association of REALTORS®. All four U.S. regions posted monthly losses and year-over-year declines in transactions.This was way below expectations of a 1.0% decrease for this index. Note: Contract signings usually lead sales by about 45 to 60 days, so this would usually be for closed sales in August and September.
"Mortgage rates have been rising above 7% since August, which has diminished the pool of home buyers," said Lawrence Yun, NAR chief economist. "Some would-be home buyers are taking a pause and readjusting their expectations about the location and type of home to better fit their budgets."
The Pending Home Sales Index (PHSI)* – a forward-looking indicator of home sales based on contract signings – sank 7.1% to 71.8 in August. Year over year, pending transactions fell by 18.7%. An index of 100 is equal to the level of contract activity in 2001.
...
The Northeast PHSI declined 0.9% from last month to 62.6, a reduction of 18.2% from August 2022. The Midwest index dropped 7.0% to 71.3 in August, down 19.1% from one year ago.
The South PHSI fell 9.1% to 86.5 in August, dipping 17.6% from the prior year. The West index retreated 7.7% in August to 56.3, sinking 21.4% from August 2022.
emphasis added
Q2 GDP Growth at 2.1% Annual Rate
by Calculated Risk on 9/28/2023 08:43:00 AM
From the BEA: Gross Domestic Product (Third Estimate), Corporate Profits (Revised Estimate), Second Quarter 2023 and Comprehensive Update
Real gross domestic product (GDP) increased at an annual rate of 2.1 percent in the second quarter of 2023, according to the "third" estimate released by the Bureau of Economic Analysis. In the first quarter, real GDP increased 2.2 percent (revised).Here is a Comparison of Third and Second Estimates. PCE growth was revised down from 1.7% to 0.8%. Residential investment was revised up from -3.6% to -2.2%.
The GDP estimate released today is based on more complete source data than were available for the "second" estimate issued last month. In the second estimate, the increase in GDP was also 2.1 percent. The update primarily reflected a downward revision to consumer spending that was partly offset by upward revisions to nonresidential fixed investment, exports, and inventory investment. Imports, which are a subtraction in the calculation of GDP, were revised down (refer to “Updates to GDP”).
The increase in real GDP reflected increases in nonresidential fixed investment, consumer spending, and state and local government spending that were partly offset by a decrease in exports. Imports decreased.
emphasis added
 Click on graph for larger image.
The BEA also released the Comprehensive Update.
Note that Q2 and Q3 2020 are off the chart due to the pandemic and are labeled.
Weekly Initial Unemployment Claims Increase to 204,000
by Calculated Risk on 9/28/2023 08:30:00 AM
The DOL reported:
In the week ending September 23, the advance figure for seasonally adjusted initial claims was 204,000, an increase of 2,000 from the previous week's revised level. The previous week's level was revised up by 1,000 from 201,000 to 202,000. The 4-week moving average was 211,000, a decrease of 6,250 from the previous week's revised average. The previous week's average was revised up by 250 from 217,000 to 217,250.The following graph shows the 4-week moving average of weekly claims since 1971.
emphasis added
 Click on graph for larger image.
The dashed line on the graph is the current 4-week average. The four-week average of weekly unemployment claims decreased to 211,000.
The previous week was revised up.
Weekly claims were lower than the consensus forecast.
Wednesday, September 27, 2023
Thursday: Q2 GDP, Unemployment Claims, Pending Home Sales, Fed Chair Powell
by Calculated Risk on 9/27/2023 08:23:00 PM
Thursday:
• At 8:30 AM ET, The initial weekly unemployment claims report will be released. The consensus is for 206 thousand initial claims, up from 201 thousand last week.
• Also at 8:30 AM, Gross Domestic Product, 2nd Quarter 2023 (Third Estimate), and Corporate Profits (Revised) The consensus is that real GDP increased 2.2% annualized in Q2, up from the second estimate of 2.1%. "BEA will release initial results from the 2023 comprehensive update of the National Economic Accounts, which include the National Income and Product Accounts as well as the Industry Economic Accounts, on September 28, 2023."
• At 10:00 AM, Pending Home Sales Index for August. The consensus is 1.0% decrease in the index.
• At 11:00 AM, the Kansas City Fed manufacturing survey for September. This is the last of the regional surveys for September.
• At 4:00 PM, Conversation with Fed Chair Powell: A Teacher Town Hall Meeting "Federal Reserve Board Chair Jerome H. Powell will host a town hall with educators in Washington, D.C. and nationwide via webcast ... The Chair will respond to questions from the in-person audience and virtual participants from across the country."
A few comments on the Seasonal Pattern for House Prices
by Calculated Risk on 9/27/2023 04:13:00 PM
Two key points:
1) There is a clear seasonal pattern for house prices.
2) The surge in distressed sales during the housing bust distorted the seasonal pattern. This was because distressed sales (at lower price points) happened at a steady rate all year, while regular sales followed the normal seasonal pattern. This made for larger swings in the seasonal factor during the housing bust.
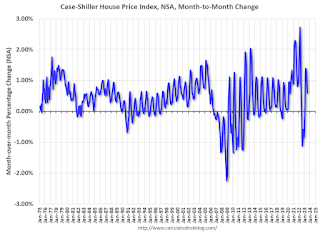
This graph shows the month-to-month change in the NSA Case-Shiller National index since 1987 (through July 2023). The seasonal pattern was smaller back in the '90s and early '00s and increased once the bubble burst.
The seasonal swings declined following the bust, however the more recent price surge changed the month-over-month pattern.
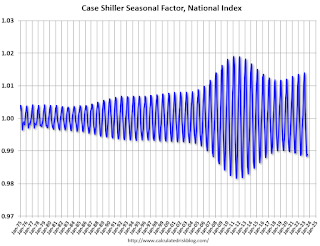
The swings in the seasonal factors were decreasing following the bust but have increased again recently - this time without a surge in distressed sales.
A Few Comments on the Likely Government Shutdown
by Calculated Risk on 9/27/2023 01:29:00 PM
First, shutdowns are expensive, and many government employees continue to work (like the military), but don't get paid. This time President Biden and Speaker McCarthy agreed on a plan, but the Speaker has been unable to deliver. So, the path forward isn't clear.
Second, there will be an impact on GDP from Goldman Sachs:
A government shutdown this year has looked likely for several months, and we now think the odds have risen to 90%. ... We continue to think a shutdown would last 2-3 weeks.And from Nick Timiraos at the WSJ: Shutdown Would Blindfold Fed in Piloting Course on Rates. We will all be flying mostly blind without reports on employment, inflation, housing starts and more. However, there will be some private data to fill the gap.
We have estimated a shutdown would subtract 0.2pp from Q4 GDP growth for each week it lasts ... We expect all data releases from federal agencies to be postponed until after the government reopens, except for releases from the Federal Reserve, which does not rely on congressional funding.
For housing, depending on the length of the shutdown, the impact would be on existing home closings in October. If the shutdown lasts for the entire month, I'd expect about a 10% decline in seasonally adjusted sales in October. If the shutdown only lasts a couple of weeks, there would probably be little impact. Some issues could be Tax transcripts, Flood Certs, and SS# Authorization.
Inflation Adjusted House Prices 3.4% Below Peak; Price-to-rent index is 7.4% below recent peak
by Calculated Risk on 9/27/2023 09:30:00 AM
Today, in the Calculated Risk Real Estate Newsletter: Inflation Adjusted House Prices 3.4% Below Peak; Price-to-rent index is 7.4% below recent peak
Excerpt:
It has been over 17 years since the bubble peak. In the June Case-Shiller house price index released yesterday, the seasonally adjusted National Index (SA), was reported as being 66% above the bubble peak in 2006. However, in real terms, the National index (SA) is about 9% above the bubble peak (and historically there has been an upward slope to real house prices). The composite 20, in real terms, is at the bubble peak.
People usually graph nominal house prices, but it is also important to look at prices in real terms. As an example, if a house price was $200,000 in January 2000, the price would be $360,000 today adjusted for inflation (80% increase). That is why the second graph below is important - this shows "real" prices.
The third graph shows the price-to-rent ratio, and the fourth graph is the affordability index. The last graph shows the 5-year real return based on the Case-Shiller National Index.


