by Calculated Risk on 10/03/2023 06:33:00 PM
Tuesday, October 03, 2023
Vehicles Sales increase to 15.67 million SAAR in September; Up 15% YoY
Wards Auto released their estimate of light vehicle sales for September: September U.S. Light-Vehicles Sales Bounce Back Despite Gloomy Conditions (pay site).
Hard to say exactly how much but sales could have been slightly stronger in September if not for some lost inventory caused by production cuts related to plant shutdowns from UAW strikes at Ford, General Motors and Stellantis. Sales losses will be more strongly felt in October as production cuts mount.
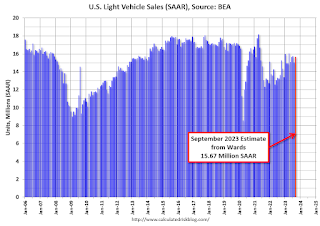 Click on graph for larger image.
This graph shows light vehicle sales since 2006 from the BEA (blue) and Wards Auto's estimate for September (red).
The impact of COVID-19 was significant, and April 2020 was the worst month. After April 2020, sales increased, and were close to sales in 2019 (the year before the pandemic). However, sales decreased in 2021 due to supply issues. The "supply chain bottom" was in September 2021.
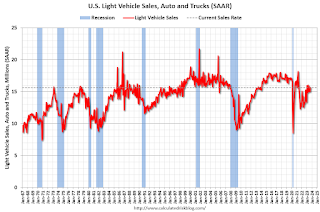 The second graph shows light vehicle sales since the BEA started keeping data in 1967.
 Sales in September were above the consensus forecast.
Update: Lumber Prices Down 11% YoY
by Calculated Risk on 10/03/2023 02:42:00 PM
This graph shows CME random length framing futures through last August (blue), and the new physically-delivered Lumber Futures (LBR) contract starting in August 2022 (Red).
FHFA’s National Mortgage Database: Outstanding Mortgage Rates, LTV and Credit Scores
by Calculated Risk on 10/03/2023 12:04:00 PM
Today, in the Calculated Risk Real Estate Newsletter: FHFA’s National Mortgage Database: Outstanding Mortgage Rates, LTV and Credit Scores
A brief excerpt:
Here are some graphs on outstanding mortgages by interest rate, the average mortgage interest rate, borrowers’ credit scores and current loan-to-value (LTV) from the FHFA’s National Mortgage Database through Q2 2023 (released last Friday).There is much more in the article. You can subscribe at https://calculatedrisk.substack.com/
...
This shows the surge in the percent of loans under 3%, and also under 4%, starting in early 2020 as mortgage rates declined sharply during the pandemic. The percent of outstanding loans under 4% peaked in Q1 2022 at 65.3%, and the percent under 5% peaked at 85.6%. These low existing mortgage rates makes it difficult for homeowners to sell their homes and buy a new home since their monthly payments would increase sharply. This is a key reason existing home inventory levels are so low.
The percent of loans over 6% bottomed in Q2 2022 at 7.1% and has increased to 10.5% in Q2 2023.
BLS: Job Openings Increased to 9.6 million in August
by Calculated Risk on 10/03/2023 10:00:00 AM
From the BLS: Job Openings and Labor Turnover Summary
The number of job openings increased to 9.6 million on the last business day of August, the U.S. Bureau of Labor Statistics reported today. Over the month, the number of hires and total separations changed little at 5.9 million and 5.7 million, respectively. Within separations, quits (3.6 million) and layoffs and discharges (1.7 million) changed little.The following graph shows job openings (black line), hires (dark blue), Layoff, Discharges and other (red column), and Quits (light blue column) from the JOLTS.
emphasis added
This series started in December 2000.
Note: The difference between JOLTS hires and separations is similar to the CES (payroll survey) net jobs headline numbers. This report is for August; the employment report this Friday will be for September.
 Click on graph for larger image.
Note that hires (dark blue) and total separations (red and light blue columns stacked) are usually pretty close each month. This is a measure of labor market turnover. When the blue line is above the two stacked columns, the economy is adding net jobs - when it is below the columns, the economy is losing jobs.
The spike in layoffs and discharges in March 2020 is labeled, but off the chart to better show the usual data.
Jobs openings increased in August to 9.61 million from 8.92 million in July.
The number of job openings (black) were down 6% year-over-year.
Quits were down 14% year-over-year. These are voluntary separations. (See light blue columns at bottom of graph for trend for "quits").
CoreLogic: US Annual Home Price Growth Rate Increased in August
by Calculated Risk on 10/03/2023 08:30:00 AM
Notes: This CoreLogic House Price Index report is for August. The recent Case-Shiller index release was for July. The CoreLogic HPI is a three-month weighted average and is not seasonally adjusted (NSA).
From CoreLogic: US Annual Home Price Growth Picks Up Pace in August, CoreLogic Reports
• U.S. home prices increased year over year for the 139th consecutive month in August.This index was up 2.5% YoY in July.
• Home prices are 42% higher compared with March 2020, when the pandemic began.
• August’s annual 3.7% home price gain was the highest since February 2023.
• CoreLogic projects that year-over-year home price appreciation will relax slightly by August 2024 to 3.4%.
• Eight states, mostly in the West, saw year-over-year home price declines, the fewest since February 2023.
• Of large metro areas, Miami continued to lead the country for annual home price growth, with an 8.3% gain.
• The median sales price for a U.S. single-family home remained at $375,000 in August, with California ($705,000), the District of Columbia ($630,000) and Massachusetts ($585,000) again leading the nation.
...
CoreLogic’s Home Price Index dropped to an 11-year low in the spring of 2023 but is starting to regain momentum. While some states in the West still posted annual home price losses in August, that number has been decreasing since the spring of this year. Meanwhile, housing markets in New England are starting to heat up, with New Hampshire, Maine, Vermont and Rhode Island seeing the largest year-over-year price gains in August.
“While continued mortgage rate increases challenge affordability across U.S. housing markets, home price growth is in line with typical seasonal averages, reflecting strong demand bolstered by a healthy labor market, strong wage growth and supporting demographic trends,“ said Selma Hepp, chief economist for CoreLogic. “Still, with a slower buying season ahead and the surging cost of homeownership, additional monthly price gains may taper off.”
emphasis added
Monday, October 02, 2023
Tuesday: Job Openings, Vehicle Sales
by Calculated Risk on 10/02/2023 07:19:00 PM

The average didn't quite make it back to the multidecade highs seen last week, but the average borrower would see little--if any--difference in today's rate quotes. This represents a fairly big jump up from Friday (which saw a nice correction down from Thursday's highs).Tuesday:
There are a few culprits--some specific, some general. One specific culprit was the market's reaction to the stop-gap bill that averted the government shutdown. Another specific and more obvious culprit was the stronger-than-expected outcome in today's important manufacturing data. [30 year fixed 7.61%]
emphasis added
• At 8:00 AM ET, Corelogic House Price index for August.
• At 10:00 AM, Job Openings and Labor Turnover Survey for August from the BLS.
• All day, Light vehicle sales for September. The consensus is for sales of 15.4 million SAAR, up from 15.0 million SAAR in August (Seasonally Adjusted Annual Rate).
Energy expenditures as a percentage of PCE
by Calculated Risk on 10/02/2023 05:32:00 PM
During the early stages of the pandemic, energy expenditures as a percentage of PCE hit an all-time low of 3.3% of PCE. Then energy expenditures increased to 2018 levels by the end of 2021.
This graph shows expenditures on energy goods and services as a percent of total personal consumption expenditures. This is one of the measures that Professor Hamilton at Econbrowser looks at to evaluate any drag on GDP from energy prices.

Click on graph for larger image.
Data source: BEA.
In general, energy expenditures as a percent of PCE has been trending down for decades. The huge spikes in energy prices during the oil crisis of 1973 and 1979 are obvious. As is the increase in energy prices during the 2001 through 2008 period.
ICE (Black Knight) Mortgage Monitor: "Home Prices Set Yet Another Record in August"
by Calculated Risk on 10/02/2023 10:53:00 AM
Today, in the Calculated Risk Real Estate Newsletter: ICE (Black Knight) Mortgage Monitor: "Home Prices Set Yet Another Record in August"
A brief excerpt:
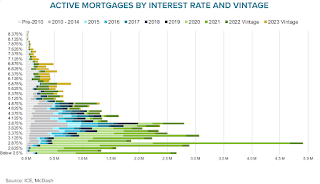
Some interesting data on mortgage rates. Note the higher mortgage rates for the 2023 vintage - still a small portion of the overall market. A large portion of active mortgages are in the 2020-2022 vintages.There is much more in the article. You can subscribe at https://calculatedrisk.substack.com/
• Given all the talk about near-term prepayment risk – and quick-turn refinance incentive – among recent originations, we thought it prudent to see how much refinance volume may make its way into the market should 30-year rates begin to ease
• As loans seasoned between two and ten years tend to have rates lower than 5%, we explore the distribution of current interest rates among recent originations to help quantify where any pockets of opportunity may exist
• Mortgages originated over the past 18 months are evenly distributed across rate bands ranging from the mid-3% range up through the high 6% range, meaning that rate/term refinance volumes would return gradually should rates improve
• Relatively few loans (~600K as of August month end) have interest rates at or above 7%, such that it would take rates markedly lower than they are today to spur any meaningful refinance incentive
• While 600K may sound significant, historically an average month yields 430K refinances, if every homeowner with a first lien rate of 7% or higher were to refinance it would only result in 1.5 months of ‘normal’ volume
• Another 1.9M loans have rates between 6% and 7%, which would produce moderate opportunity, but rates would need to come down to the mid- to low-5% range to put all of those borrowers in the money, and even that would only be enough for a few months of sustained volume
emphasis added
Construction Spending Increased 0.5% in August
by Calculated Risk on 10/02/2023 10:19:00 AM
From the Census Bureau reported that overall construction spending increased:
Construction spending during August 2023 was estimated at a seasonally adjusted annual rate of $1,983.5 billion, 0.5 percent above the revised July estimate of $1,973.7 billion. The August figure is 7.4 percent above the August 2022 estimate of $1,847.3 billion.Both private and public spending increased:
emphasis added
Spending on private construction was at a seasonally adjusted annual rate of $1,551.8 billion, 0.5 percent above the revised July estimate of $1,544.6 billion. ...
In August, the estimated seasonally adjusted annual rate of public construction spending was $431.6 billion, 0.6 percent above the revised July estimate of $429.1 billion.
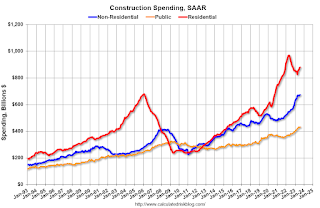 Click on graph for larger image.
This graph shows private residential and nonresidential construction spending, and public spending, since 1993. Note: nominal dollars, not inflation adjusted.
Residential (red) spending is 9.3% below the recent peak.
Non-residential (blue) spending is at a new peak.
Public construction spending is also at a new peak.
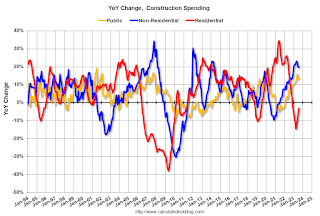 The second graph shows the year-over-year change in construction spending.
On a year-over-year basis, private residential construction spending is down 3.1%. Non-residential spending is up 19.7% year-over-year. Public spending is up 14.1% year-over-year.
ISM® Manufacturing index Increased to 49.0% in September
by Calculated Risk on 10/02/2023 10:00:00 AM
(Posted with permission). The ISM manufacturing index indicated contraction. The PMI® was at 49.0% in September, up from 47.6% in August. The employment index was at 51.2%, up from 48.5% the previous month, and the new orders index was at 49.2%, up from 46.8%.
From ISM: Manufacturing PMI® at 49%
September 2023 Manufacturing ISM® Report On Business®
conomic activity in the manufacturing sector contracted in September for the 11th consecutive month following a 28-month period of growth, say the nation's supply executives in the latest Manufacturing ISM® Report On Business®.This suggests manufacturing contracted in September. This was above the consensus forecast. Note that the price index was at 43.8% (falling prices).
The report was issued today by Timothy R. Fiore, CPSM, C.P.M., Chair of the Institute for Supply Management® (ISM®) Manufacturing Business Survey Committee:
“The Manufacturing PMI® registered 49 percent in September, 1.4 percentage points higher than the 47.6 percent recorded in August. The overall economy expanded weakly after nine months of contraction following a 30-month period of expansion. (A Manufacturing PMI® above 48.7 percent, over a period of time, generally indicates an expansion of the overall economy.) The New Orders Index remained in contraction territory at 49.2 percent, 2.4 percentage points higher than the figure of 46.8 percent recorded in August. The Production Index reading of 52.5 percent is a 2.5-percentage point increase compared to August’s figure of 50 percent. The Prices Index registered 43.8 percent, down 4.6 percentage points compared to the reading of 48.4 percent in August. The Backlog of Orders Index registered 42.4 percent, 1.7 percentage points lower than the August reading of 44.1 percent. The Employment Index registered 51.2 percent, up 2.7 percentage points from the 48.5 percent reported in August.
emphasis added


