by Calculated Risk on 10/04/2023 08:00:00 PM
Wednesday, October 04, 2023
Thursday: Unemployment Claims, Trade Deficit

Thursday:
• At 8:30 AM ET, The initial weekly unemployment claims report will be released. The consensus is for 208 thousand initial claims, up from 204 thousand last week.
• Also at 8:30 AM, Trade Balance report for August from the Census Bureau. The consensus is for the deficit to be $65.1 billion in August, from $65.0 billion in July.
Las Vegas August 2023: Visitor Traffic Up 4.0% YoY; Convention Traffic Up Sharply YoY
by Calculated Risk on 10/04/2023 07:11:00 PM
From the Las Vegas Visitor Authority: August 2023 Las Vegas Visitor Statistics
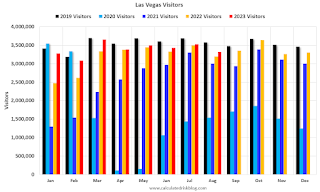
August was a solid month with more than 3.3M visitors as weekend occupancy was largely on par with last year while midweek saw notable gains supported in part by a strengthening convention segment that included recurring shows such as ASD Market Week as well the Summer 2023 Las Vegas Market show at World Market Center which fell in August this year vs. July in 2022.
Overall hotel occupancy reached 80.3% for the month (+3.5 pts YoY) as Weekend occupancy came in at 89.7% (‐0.4 pts YoY), and Midweek occupancy reached 77.0%, surpassing last August by 4.8 pts.
ADR growth continued in August, approaching $159, +7.0% YoY while RevPAR exceeded $127, +11.9% YoY
 Click on graph for larger image.
 The first graph shows visitor traffic for 2019 (Black), 2020 (light blue), 2021 (purple), 2022 (orange), and 2023 (red).
Visitor traffic was up 4.0% compared to last August.
Note: There was almost no convention traffic from April 2020 through May 2021.
Lawler: The Second Half “Bear Steepener”: Higher for Longer, a Higher R*, and A Rising Term Premium
by Calculated Risk on 10/04/2023 03:45:00 PM
Today, in the Calculated Risk Real Estate Newsletter: Lawler: The Second Half “Bear Steepener”: Higher for Longer, a Higher R*, and A Rising Term Premium
A brief excerpt:
NOTE: This is technical and related to these earlier notes (and mortgage rates):There is much more in the article. You can subscribe at https://calculatedrisk.substack.com/
August 18th: Lawler: Is The “Natural” Rate of Interest Back to Pre-Financial Crisis Levels?
August 15th: The "New Normal" Mortgage Rate Range
From housing economist Tom Lawler:
Below is a chart showing the Treasury yield curve from 1 to 30 years yesterday compared to the end of each of the previous four months.
...
As the graph and table show, the one-year Treasury yield hasn’t moved much since middle of the year, while the 10- and 30-year Treasury yields have increased by over 100 basis points. While the yield curve is still very inverted by historical standards, it is a far cry from the “uber-inversion” of earlier in the year.
Strikes and the Impact on the Employment Report
by Calculated Risk on 10/04/2023 02:09:00 PM
Workers on strike during the reference week are not counted as employed in the BLS employment report. Every month, on the Friday before the release of the employment report, the BLS releases the CES Strike Report showing the number of workers on strike during the reference period.

In September, 17,700 workers were on strike, mostly the now settled writers' strike. Ended strikes give a boost to the employment report (this was a few thousand in September).
Heavy Truck Sales Solid in September, Up 5% YoY
by Calculated Risk on 10/04/2023 12:39:00 PM
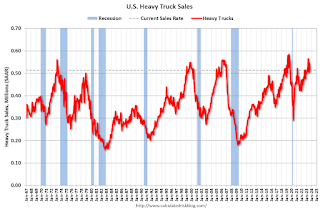
This graph shows heavy truck sales since 1967 using data from the BEA. The dashed line is the September 2023 seasonally adjusted annual sales rate (SAAR).
Heavy truck sales really collapsed during the great recession, falling to a low of 180 thousand SAAR in May 2009. Then heavy truck sales increased to a new record high of 570 thousand SAAR in April 2019.
 Click on graph for larger image.
Note: "Heavy trucks - trucks more than 14,000 pounds gross vehicle weight."
Heavy truck sales declined sharply at the beginning of the pandemic, falling to a low of 308 thousand SAAR in May 2020.
As I noted yesterday, Vehicles Sales increase to 15.67 million SAAR in September; Up 15% YoY
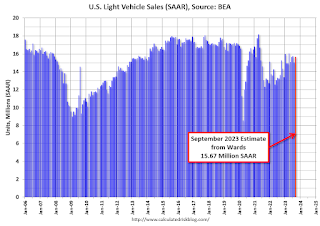
 The second graph shows light vehicle sales since the BEA started keeping data in 1967. Vehicle sales were at 15.67 million SAAR in September, up from 15.34 million in August, and up 14% from 13.50 million in Seeptember 2022.
ISM® Services Index Decreases to 53.6% in September
by Calculated Risk on 10/04/2023 10:00:00 AM
(Posted with permission). The ISM® Services index was at 53.6%, down from 54.5% last month. The employment index decreased to 53.4%, from 54.7%. Note: Above 50 indicates expansion, below 50 in contraction.
From the Institute for Supply Management: Services PMI® at 53.6%; September 2023 Services ISM® Report On Business®
Economic activity in the services sector expanded in September for the ninth consecutive month as the Services PMI® registered 53.6 percent, say the nation's purchasing and supply executives in the latest Services ISM® Report On Business®. The sector has grown in 39 of the last 40 months, with the lone contraction in December 2022.The PMI was at expectations.
The report was issued today by Anthony Nieves, CPSM, C.P.M., A.P.P., CFPM, Chair of the Institute for Supply Management® (ISM®) Services Business Survey Committee: “In September, the Services PMI® registered 53.6 percent, 0.9 percentage point lower than August’s reading of 54.5 percent. The composite index indicated growth in September for the ninth consecutive month after a reading of 49.2 percent in December 2022, which was the first contraction since June 2020 (45.4 percent). The Business Activity Index registered 58.8 percent, a 1.5-percentage point increase compared to the reading of 57.3 percent in August. The New Orders Index expanded in September for the ninth consecutive month after contracting in December for the first time since May 2020; the figure of 51.8 percent is 5.7 percentage points lower than the August reading of 57.5 percent.
emphasis added
ADP: Private Employment Increased 89,000 in September
by Calculated Risk on 10/04/2023 08:19:00 AM
Private sector employment increased by 89,000 jobs in September and annual pay was up 5.9 percent year-over-year, according to the September ADP® National Employment ReportTM produced by the ADP Research Institute® in collaboration with the Stanford Digital Economy Lab (“Stanford Lab”).This was below the consensus forecast of 150,000. The BLS report will be released Friday, and the consensus is for 150 thousand non-farm payroll jobs added in September.
...
“We are seeing a steepening decline in jobs this month,” said Nela Richardson, chief economist ADP. “Additionally, we are seeing a steady decline in wages in the past 12 months.”
emphasis added
MBA: Mortgage Applications Decreased in Weekly Survey; Purchase Apps Lowest Since 1995
by Calculated Risk on 10/04/2023 07:00:00 AM
From the MBA: Mortgage Applications Decrease in Latest MBA Weekly Survey
Mortgage applications decreased 6.0 percent from one week earlier, according to data from the Mortgage Bankers Association’s (MBA) Weekly Mortgage Applications Survey for the week ending September 29, 2023.
The Market Composite Index, a measure of mortgage loan application volume, decreased 6.0 percent on a seasonally adjusted basis from one week earlier. On an unadjusted basis, the Index decreased 6 percent compared with the previous week. The Refinance Index decreased 7 percent from the previous week and was 11 percent lower than the same week one year ago. The seasonally adjusted Purchase Index decreased 6 percent from one week earlier. The unadjusted Purchase Index decreased 6 percent compared with the previous week and was 22 percent lower than the same week one year ago.
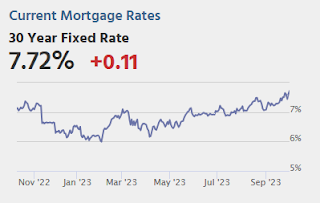
“Mortgage rates continued to move higher last week as markets digested the recent upswing in Treasury yields. Rates for all mortgage products increased, with the 30-year fixed mortgage rate increasing for the fourth consecutive week to 7.53 percent – the highest rate since 2000,” said Joel Kan, MBA’s Vice President and Deputy Chief Economist. “As a result, mortgage applications ground to a halt, dropping to the lowest level since 1996. The purchase market slowed to the lowest level of activity since 1995, as the rapid rise in rates pushed an increasing number of potential homebuyers out of the market. ARM loan applications picked up over the week and the ARM share increased to 8 percent, as some borrowers searched for ways to lower their payments.”
...
The average contract interest rate for 30-year fixed-rate mortgages with conforming loan balances ($726,200 or less) increased to 7.53 percent from 7.41 percent, with points increasing to 0.80 from 0.71 (including the origination fee) for 80 percent loan-to-value ratio (LTV) loans.
emphasis added
 Click on graph for larger image.
The first graph shows the MBA mortgage purchase index.
According to the MBA, purchase activity is down 22% year-over-year unadjusted.

Tuesday, October 03, 2023
Wednesday: ADP Employment, ISM Services
by Calculated Risk on 10/03/2023 09:08:00 PM

Wednesday:
• At 7:00 AM ET, The Mortgage Bankers Association (MBA) will release the results for the mortgage purchase applications index.
• At 8:15 AM, The ADP Employment Report for September. This report is for private payrolls only (no government). The consensus is for 150,000 jobs added, down from 177,000 in August.
• At 10:00 AM, the ISM Services Index for September.
Vehicles Sales increase to 15.67 million SAAR in September; Up 15% YoY
by Calculated Risk on 10/03/2023 06:33:00 PM
Wards Auto released their estimate of light vehicle sales for September: September U.S. Light-Vehicles Sales Bounce Back Despite Gloomy Conditions (pay site).
Hard to say exactly how much but sales could have been slightly stronger in September if not for some lost inventory caused by production cuts related to plant shutdowns from UAW strikes at Ford, General Motors and Stellantis. Sales losses will be more strongly felt in October as production cuts mount.
 Click on graph for larger image.
This graph shows light vehicle sales since 2006 from the BEA (blue) and Wards Auto's estimate for September (red).
The impact of COVID-19 was significant, and April 2020 was the worst month. After April 2020, sales increased, and were close to sales in 2019 (the year before the pandemic). However, sales decreased in 2021 due to supply issues. The "supply chain bottom" was in September 2021.
 The second graph shows light vehicle sales since the BEA started keeping data in 1967.
 Sales in September were above the consensus forecast.


