by Calculated Risk on 10/06/2023 07:55:00 PM
Friday, October 06, 2023
Oct 6th COVID Update: Deaths and Hospitalizations Increased
| COVID Metrics | ||||
|---|---|---|---|---|
| Now | Week Ago | Goal | ||
| Hospitalized2 | 15,512 | 15,813 | ≤3,0001 | |
| Deaths per Week2 | 1,213 | 1,222 | ≤3501 | |
| 1my goals to stop weekly posts, 2Weekly for Currently Hospitalized, and Deaths 🚩 Increasing number weekly for Hospitalized and Deaths ✅ Goal met. | ||||
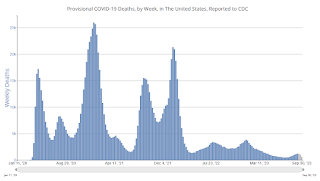 Click on graph for larger image.
This graph shows the weekly (columns) number of deaths reported.
AAR: September Rail Carloads and Intermodal Increased Year-over-year
by Calculated Risk on 10/06/2023 05:49:00 PM
From the Association of American Railroads (AAR) Rail Time Indicators. Graphs and excerpts reprinted with permission.
As is usually the case, in September some rail sectors did better than others. There were clearly some good signs.
For example, U.S. intermodal originations in September 2023 averaged 252,224 containers and trailers per week, the most for any month since October 2022. August, September, and October are typically the highest-volume U.S. intermodal months, reflecting “peak season” shipments ahead of the holidays. In September, intermodal originations were up 0.7% over last year, just their second increase in 26 months. ...
Total carloads on U.S. railroads in September 2023 were up 2.3% over September 2022, their first increase in four months and their biggest percentage gain since January 2023. Total carloads averaged 230,429 per week in September 2023, the most since October 2022. Year-to-date total carloads were up 0.3% over 2022 and up 0.7% over 2021
emphasis added
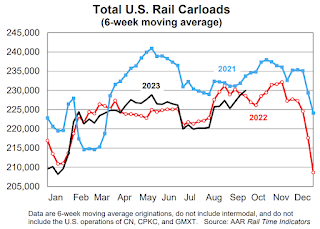 Click on graph for larger image.
This graph from the Rail Time Indicators report shows the six-week average of U.S. Carloads in 2021, 2022 and 2022:
U.S. railroads originated 921,716 total carloads in September 2023, up 2.3% (20,754 carloads) over September 2022. That’s the first year-over-year increase for total carloads in four months and the biggest percentage increase since January 2023. Total carloads averaged 230,429 per week in September 2023, the most since October 2022. Intermodal isn’t included in carloads.
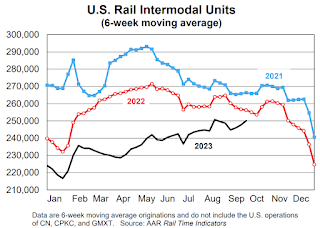 The second graph shows the six-week average (not monthly) of U.S. intermodal in 2021, 2022 and 2023: (using intermodal or shipping containers):
U.S. intermodal originations were up 0.7% in September 2023 over September 2022. That’s just the second year-over-year increase for intermodal since July 2021, a span of 26 months. (The other increase, in February 2022 over February 2021, shouldn’t count because it was a function of severe ice storms in February 2021 that caused an easy comparison when February 2022 came along.) U.S. intermodal volume in September 2023 averaged 252,224 containers and trailers per week, the most for any month since October 2022.
1st Look at Local Housing Markets in September; Early Reporting Markets suggest Sales at New Cycle Low in September
by Calculated Risk on 10/06/2023 01:20:00 PM
Today, in the Calculated Risk Real Estate Newsletter: 1st Look at Local Housing Markets in September
A brief excerpt:
This is the first look at several early reporting local markets in September. I’m tracking about 40 local housing markets in the US. Some of the 40 markets are states, and some are metropolitan areas. I’ll update these tables throughout the month as additional data is released.There is much more in the article. You can subscribe at https://calculatedrisk.substack.com/
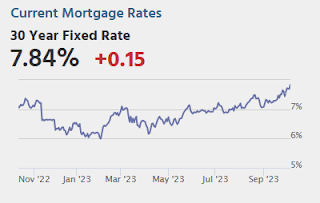
Closed sales in September were mostly for contracts signed in July and August. Since 30-year fixed mortgage rates were in the 6.8% range in July, and 7.1% in August, compared to the low-5% range the previous year, closed sales were down year-over-year in September.
...
Here is a summary of active listings for these early reporting housing markets in September.
Inventory surged in some of these markets last year, but that has changed.
For example, inventory in Denver was up 93% YoY in September 2022, and is now down 1% YoY. And inventory in Las Vegas was up 144% YoY in September 2022, and is now down 49% YoY. That is a HUGE change.
Inventory for these markets were down 16% YoY in August and are now down 12.5% YoY.
...
This was just several early reporting markets. Many more local markets to come!
Q3 GDP Tracking: Moving on up!
by Calculated Risk on 10/06/2023 12:22:00 PM
From BofA:
Overall, the data flow since our last weekly pushed up our 3Q US GDP tracking estimate from 2.8% to 3.7% q/q saar. [Sept 29th estimate]From Goldman:
emphasis added
[We] boosted our Q3 GDP tracking estimate by 0.3pp to 3.7% (qoq ar). Our domestic final sales growth forecast stands at +2.4%. [Oct 5th estimate]And from the Altanta Fed: GDPNow
The GDPNow model estimate for real GDP growth (seasonally adjusted annual rate) in the third quarter of 2023 is 4.9 percent on October 5, unchanged from October 2 after rounding. After recent releases from the US Census Bureau, the Bureau of Economic Analysis, and the Institute for Supply Management, a decrease in the nowcast of third-quarter real personal consumption expenditures growth from 3.8 percent to 3.7 percent was offset by an increase in the nowcast of third-quarter real gross private domestic investment growth from 5.4 percent to 5.9 percent. [Oct 5th estimate]
Wholesale Used Car Prices Increased 1.0% in September; Down 3.9% Year-over-year
by Calculated Risk on 10/06/2023 10:39:00 AM
From Manheim Consulting today: Wholesale Used-Vehicle Prices See Minimal Increase in August
Wholesale used-vehicle prices (on a mix, mileage, and seasonally adjusted basis) increased 1.0% in September from August. The Manheim Used Vehicle Value Index (MUVVI) rose to 214.3, down 3.9% from a year ago.
“September auction sales bolstered prices through the channel,” said Chris Frey, senior manager of Economic and Industry Insights for Cox Automotive. “While there was a bit of an acceleration from August, we shouldn’t get ahead of ourselves heading into the late fall and winter period. We are at a crossroads for wholesale, mainly from concerns about the UAW strike’s potentially slowing new retail sales and moving buyers into the used market. We don’t see that happening just yet, as it always takes time for changes to work through the market. Two very different outcomes are possible. One is to see higher prices from an extended strike on new production also showing up at wholesale and then used retail. The second leads to very little change – a strike resolution leading to price declines at relatively normal rates, or simply pausing, thus the wholesale and used retail markets are minimally affected. While we have some modest changes built into our MUVVI forecast, we think the market mainly reflects balance at this point, relative to what we have been seeing for much of the last three years. We typically see only slight upward trends in wholesale values in the fourth quarter, which is why are forecasting our Used Vehicle Value Index to finish down 2.2% for the year.”
The seasonal adjustment contributed to September’s increase. The non-adjusted price in September increased by 0.1% compared to August, moving the unadjusted average price down 5.4% year over year.
emphasis added
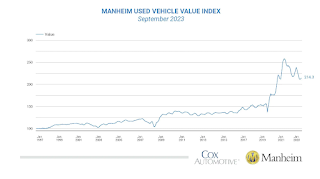 Click on graph for larger image.
This index from Manheim Consulting is based on all completed sales transactions at Manheim’s U.S. auctions.
Comments on September Employment Report
by Calculated Risk on 10/06/2023 09:27:00 AM
The headline jobs number in the September employment report was well above expectations, and employment for the previous two months was revised up by 119,000, combined. The participation rate and the employment population ratio were both unchanged, and the unemployment rate was also unchanged at 3.8%.
In September, the year-over-year employment change was 3.09 million jobs.
| Headline Jobs, Top 10 Streaks | ||
|---|---|---|
| Year Ended | Streak, Months | |
| 1 | 2019 | 100 |
| 2 | 1990 | 48 |
| 3 | 2007 | 46 |
| 4 | 1979 | 45 |
| 5 tie | 1943 | 33 |
| 5 tie | 1986 | 33 |
| 5 tie | 2000 | 33 |
| 5 tie | 20231 | 33 |
| 9 | 1967 | 29 |
| 10 | 1995 | 25 |
| 1Currrent Streak | ||
Prime (25 to 54 Years Old) Participation
 Since the overall participation rate is impacted by both cyclical (recession) and demographic (aging population, younger people staying in school) reasons, here is the employment-population ratio for the key working age group: 25 to 54 years old.
The 25 to 54 participation rate was unchanged in September at 83.5% from 83.5% in August, and the 25 to 54 employment population ratio declined to 80.8% from 80.9% the previous month.
Average Hourly Wages
 The graph shows the nominal year-over-year change in "Average Hourly Earnings" for all private employees from the Current Employment Statistics (CES).
 Wage growth has trended down after peaking at 5.9% YoY in March 2022 and was at 4.2% YoY in September. On an annualized basis, wages increased 2.5% in September.
Part Time for Economic Reasons
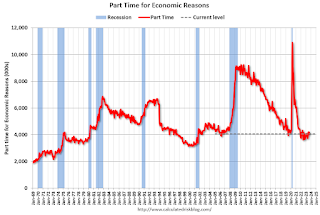 From the BLS report:
"The number of persons employed part time for economic reasons, at 4.1 million, changed little in September. These individuals, who would have preferred full-time employment, were working part time because their hours had been reduced or they were unable to find full-time jobs."The number of persons working part time for economic reasons decreased in September to 4.07 million from 4.22 million in August. This is below pre-recession levels.
These workers are included in the alternate measure of labor underutilization (U-6) that decreased to 7.0% from 7.1% in the previous month. This is down from the record high in April 22.9% and up from the lowest level on record (seasonally adjusted) in December 2022 (6.5%). (This series started in 1994). This measure is at the 7.0% level in February 2020 (pre-pandemic).
Unemployed over 26 Weeks
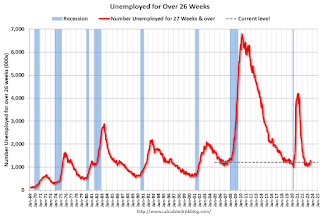 This graph shows the number of workers unemployed for 27 weeks or more.
 According to the BLS, there are 1.216 million workers who have been unemployed for more than 26 weeks and still want a job, down from 1.296 million the previous month.
This is close to the pre-pandemic levels.
Summary:
The headline monthly jobs number was well above consensus expectations; and July and August payrolls were revised up by 119,000 combined. The unemployment rate was unchanged.
September Employment Report: 336 thousand Jobs, 3.8% Unemployment Rate
by Calculated Risk on 10/06/2023 08:30:00 AM
From the BLS:
Total nonfarm payroll employment rose by 336,000 in September, and the unemployment rate was unchanged at 3.8 percent, the U.S. Bureau of Labor Statistics reported today. Job gains occurred in leisure and hospitality; government; health care; professional, scientific, and technical services; and social assistance.
...
The change in total nonfarm payroll employment for July was revised up by 79,000, from +157,000 to +236,000, and the change for August was revised up by 40,000, from +187,000 to +227,000. With these revisions, employment in July and August combined is 119,000 higher than previously reported.
emphasis added
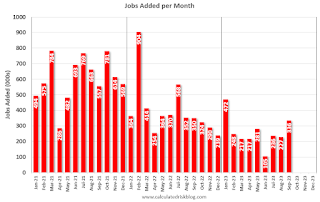 Click on graph for larger image.
The first graph shows the jobs added per month since January 2021.
Payrolls for July and August were revised up 119 thousand, combined.
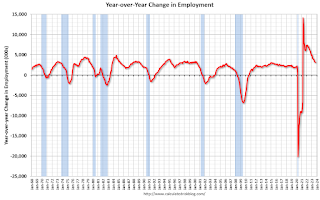 The second graph shows the year-over-year change in total non-farm employment since 1968.
In September, the year-over-year change was 3.19 million jobs. Employment was up significantly year-over-year but has slowed to more normal levels of job growth recently.
The third graph shows the employment population ratio and the participation rate.
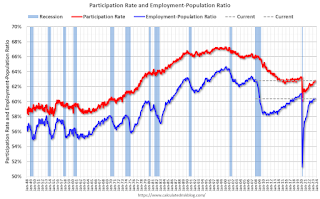 The Labor Force Participation Rate was unchanged at 62.8% in September, from 62.8% in August. This is the percentage of the working age population in the labor force.
 The Employment-Population ratio was unchanged at 60.4% from 60.4% (blue line).
I'll post the 25 to 54 age group employment-population ratio graph later.
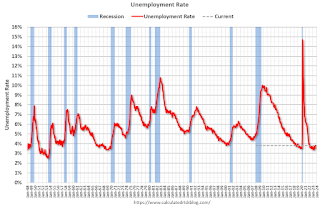 The fourth graph shows the unemployment rate.
 The unemployment rate was unchanged at 3.8% in September from 3.8% in August.
This was well above consensus expectations; and, July and August payrolls were revised up by 119,000 combined.
Thursday, October 05, 2023
Friday: Employment Report
by Calculated Risk on 10/05/2023 08:19:00 PM

Friday:
• At 8:30 AM ET, Employment Report for September. The consensus is for 150,000 jobs added, and for the unemployment rate to decrease to 3.7%.
September Employment Preview
by Calculated Risk on 10/05/2023 04:03:00 PM
On Friday at 8:30 AM ET, the BLS will release the employment report for September. The consensus is for 150,000 jobs added, and for the unemployment rate to decrease to 3.7%.
From BofA economists:
"We look for nonfarm payroll employment to increase by 185k ... we forecast the unemployment rate to fall two-tenths in September to 3.6% owing in part to a tenth decline in the labor force participation rate to 62.7%."From Goldman Sachs:
"We estimate nonfarm payrolls rose by 200k in September (mom sa) ... Big Data indicators indicate strong job growth on net, and we place little weight on the ADP miss because of its lop-sided composition and because of the negative correlation between that indicator and nonfarm payroll growth. ... We estimate that the unemployment rate declined one tenth to 3.7%."• ADP Report: The ADP employment report showed 89,000 private sector jobs were added in September. This suggests job gains below consensus expectations, however, in general, ADP hasn't been very useful in forecasting the BLS report.
• ISM Surveys: Note that the ISM services are diffusion indexes based on the number of firms hiring (not the number of hires). The ISM® manufacturing employment index increased in September to 51.2%, up from 48.5% last month. This would suggest about 10,000 job lost in manufacturing. The ADP report indicated 12,000 manufacturing jobs lost in September.
The ISM® services employment index decreased to 53.4%, down from 54.7%. This would suggest about 165,000 jobs added in the service sector. Combined this suggests job gains of 155,000 in September, close to consensus expectations.
• Unemployment Claims: The weekly claims report showed a sharp decrease in the number of initial unemployment claims during the reference week (includes the 12th of the month) from 240,000 in August to 202,000 in September. This suggests fewer layoffs in September than in August.
Moody's: "Apartment Market Softens, Office Evolution Continues, and Retail On Shaky Ground"
by Calculated Risk on 10/05/2023 01:26:00 PM
Today, in the Calculated Risk Real Estate Newsletter: Moody's: "Apartment Market Softens, Office Evolution Continues, and Retail On Shaky Ground"
A brief excerpt:
From Moody’s:There is much more in the article. You can subscribe at https://calculatedrisk.substack.com/The national office vacancy rate climbed to 19.2% in Q3 2023, rising from Q2’s 18.9% and rapidly approaching the historic peak of 19.3% set in 1991. The office landscape has struggled in 2023, though market performance is more mixed with property-specific nuances. With rising vacancies, the national office market experienced another quarter of relatively stagnant rent growth. ...Moody’s Analytics reported that the office vacancy rate was at 19.2% in Q3 2023, up from 18.9% in Q2 2023, and up from 18.5% in Q3 2022. This is just below the record high of 19.3% during the S&L crisis.


