by Calculated Risk on 10/10/2023 09:21:00 AM
Tuesday, October 10, 2023
Part 2: Current State of the Housing Market; Overview for mid-October
Today, in the Calculated Risk Real Estate Newsletter: Part 2: Current State of the Housing Market; Overview for mid-October
A brief excerpt:
Yesterday, in Part 1: Current State of the Housing Market; Overview for mid-October I reviewed home inventory and sales.There is much more in the article. You can subscribe at https://calculatedrisk.substack.com/
...
Most measures of house prices have shown an increase in prices over the last several months, and a key question I discussed in July is Will house prices decline further later this year? I will revisit this question soon.
Other measures of house prices suggest prices will be up further YoY over the next few months in the Case-Shiller index. The NAR reported median prices were up 3.9% YoY in August, up from 1.7% YoY in July. ICE / Black Knight reported prices were up 3.8% YoY in August, up from 2.4% YoY in July to new all-time highs, and Freddie Mac reported house prices were up 4.0% YoY in August, up from 2.9% YoY in July - and also to new all-time highs.
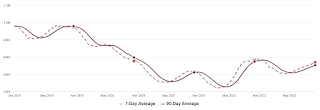
Here is a comparison of year-over-year change in the FMHPI, median house prices from the NAR, and the Case-Shiller National index.
The FMHPI and the NAR median prices appear to be leading indicators for Case-Shiller. Based on recent monthly data, and the FMHPI, the YoY change in the Case-Shiller index will increase further in the report for August.
Monday, October 09, 2023
Moody's: Mall Vacancy Rate Unchanged in Q3
by Calculated Risk on 10/09/2023 03:49:00 PM
Note: I covered apartments and offices in the newsletter: Moody's: "Apartment Market Softens, Office Evolution Continues, and Retail On Shaky Ground"
From Moody’s Analytics economists Thomas Lasalvia, Lu Chen and Nick Luettke: Apartment Market Softens, Office Evolution Continues, and Retail On Shaky Ground
Over the past decade, traditional retail forms have been challenged by e-commerce’s boom, whose share as a percentage of total retail sales has been constantly hovering above 15% since early 2023. During the sector’s ongoing revolution, retail clusters have been shifting towards service-centric and experience-oriented uses. As non-performing assets get replaced by modernized retail forms or even mixed-use communities, the retail sector ignited a long-awaited hope at the rise of pent-up consumer demand.
...
[N]eighborhood and community shopping centers held steady for another quarter. But over 85,000 sqft of net move-ins fell well under the verified new retail completions, totaling 390,000 sqft over the last three months. August and September leasing activities showed some cracks but it may still be too early to call it systematic. National vacancy stayed flat at 10.3% since early 2023. Asking/effective rents were up slightly by 0.2%/0.3% as compared to last quarter but remained in the $21/$18-per-sqft range, a level relatively unchanged since 2018.
 This graph shows the strip mall vacancy rate starting in 1980 (prior to 2000 the data is annual).
 In the mid-'00s, mall investment picked up as mall builders followed the "roof tops" of the residential boom (more loose lending). This led to the vacancy rate moving higher even before the recession started. Then there was a sharp increase in the vacancy rate during the recession and financial crisis.
Part 1: Current State of the Housing Market; Overview for mid-October
by Calculated Risk on 10/09/2023 12:02:00 PM
Today, in the Calculated Risk Real Estate Newsletter: Part 1: Current State of the Housing Market; Overview for mid-October
A brief excerpt:
The NAR reported sales were at a “seasonally adjusted annual rate of 4.04 million in August. Year-over-year, sales fell 15.3% (down from 4.77 million in August 2022).” This was in line with the local markets I tracked for August.There is much more in the article. You can subscribe at https://calculatedrisk.substack.com/
The current cycle low for existing home sales was 4.00 million SAAR in January 2023. The early local market reports suggest a new cycle low for closed sales in September!
Usually, house prices bottom after sales bottom, so a new cycle low for sales suggests likely further weakness for house prices in coming months. I’ll have more on this pattern.
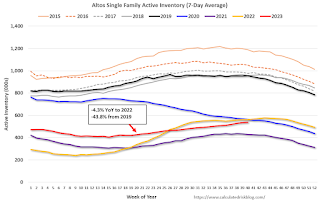
Housing October 9th Weekly Update: Inventory increased 0.4% Week-over-week; Down 4.3% Year-over-year
by Calculated Risk on 10/09/2023 08:11:00 AM
 Click on graph for larger image.
This inventory graph is courtesy of Altos Research.
Sunday, October 08, 2023
Sunday Night Futures
by Calculated Risk on 10/08/2023 06:16:00 PM
Weekend:
• Schedule for Week of October 8, 2023
Monday:
Columbus Day Holiday: Banks will be closed in observance of Columbus Day. The stock market will be open.
• At 1:30 PM: Speech, Fed Vice Chair Philip Jefferson, U.S. Economic Outlook and Monetary Policy Transmission, At the 65th National Association for Business Economics (NABE) Annual Meeting, Dallas, Texas
From CNBC: Pre-Market Data and Bloomberg futures S&P 500 futures are down 29 and DOW futures are down 199 (fair value).
Oil prices were down over the last week (Prior to the attack on Israel) with WTI futures at $84.58 per barrel and Brent at $92.20 per barrel. A year ago, WTI was at $93, and Brent was at $99 - so WTI oil prices were down about 0% year-over-year.
Here is a graph from Gasbuddy.com for nationwide gasoline prices. Nationally prices are at $3.67 per gallon. A year ago, prices were at $3.94 per gallon, so gasoline prices are down $0.27 year-over-year.
Hotels: Occupancy Rate Increased 0.8% Year-over-year
by Calculated Risk on 10/08/2023 08:11:00 AM
As expected, U.S. hotel performance was lower than the previous week, but year-over-year comparisons were improved, according to CoStar’s latest data through 30 September.The following graph shows the seasonal pattern for the hotel occupancy rate using the four-week average.
24-30 September 2023 (percentage change from comparable week in 2022):
• Occupancy: 66.7% (+0.8%)
• Average daily rate (ADR): US$157.89 (+4.6%)
• Revenue per available room (RevPAR): US$105.31 (+5.4%)
emphasis added
 Click on graph for larger image.
The red line is for 2023, black is 2020, blue is the median, and dashed light blue is for 2022. Dashed purple is for 2018, the record year for hotel occupancy.
Saturday, October 07, 2023
Real Estate Newsletter Articles this Week: Outstanding Mortgage Rates, LTV and Credit Scores
by Calculated Risk on 10/07/2023 02:11:00 PM
At the Calculated Risk Real Estate Newsletter this week:
• FHFA’s National Mortgage Database: Outstanding Mortgage Rates, LTV and Credit Scores
• Freddie Mac House Price Index Increased in August to New High; Up 4.0% Year-over-year
• Lawler: The Second Half “Bear Steepener”: Higher for Longer, a Higher R*, and A Rising Term Premium
• 1st Look at Local Housing Markets in September
• Moody's: "Apartment Market Softens, Office Evolution Continues, and Retail On Shaky Ground"
• ICE (Black Knight) Mortgage Monitor: "Home Prices Set Yet Another Record in August"
This is usually published 4 to 6 times a week and provides more in-depth analysis of the housing market.
You can subscribe at https://calculatedrisk.substack.com/
Schedule for Week of October 8, 2023
by Calculated Risk on 10/07/2023 08:11:00 AM
The key economic report this week is September CPI.
Columbus Day Holiday: Banks will be closed in observance of Columbus Day. The stock market will be open.
1:30 PM: Speech, Fed Vice Chair Philip Jefferson, U.S. Economic Outlook and Monetary Policy Transmission, At the 65th National Association for Business Economics (NABE) Annual Meeting, Dallas, Texas
6:00 AM: NFIB Small Business Optimism Index for September.
7:00 AM ET: The Mortgage Bankers Association (MBA) will release the results for the mortgage purchase applications index.
8:30 AM: The Producer Price Index for September from the BLS. The consensus is for a 0.3% increase in PPI, and a 0.2% increase in core PPI.
2:00 PM: FOMC Minutes, Minutes Meeting of September 19-20, 2023
8:30 AM: The initial weekly unemployment claims report will be released. The consensus is for 210 thousand initial claims, up from 207 thousand last week.
8:30 AM: The Consumer Price Index for September from the BLS. The consensus is for a 0.3% increase in CPI, and a 0.3% increase in core CPI. The consensus is for CPI to be up 3.6% year-over-year and core CPI to be up 4.1% YoY.
10:00 AM: University of Michigan's Consumer sentiment index (Preliminary for October).
Friday, October 06, 2023
Oct 6th COVID Update: Deaths and Hospitalizations Increased
by Calculated Risk on 10/06/2023 07:55:00 PM
| COVID Metrics | ||||
|---|---|---|---|---|
| Now | Week Ago | Goal | ||
| Hospitalized2 | 15,512 | 15,813 | ≤3,0001 | |
| Deaths per Week2 | 1,213 | 1,222 | ≤3501 | |
| 1my goals to stop weekly posts, 2Weekly for Currently Hospitalized, and Deaths 🚩 Increasing number weekly for Hospitalized and Deaths ✅ Goal met. | ||||
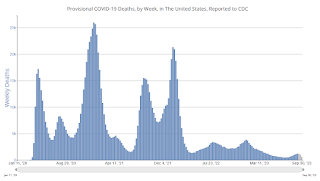 Click on graph for larger image.
This graph shows the weekly (columns) number of deaths reported.
AAR: September Rail Carloads and Intermodal Increased Year-over-year
by Calculated Risk on 10/06/2023 05:49:00 PM
From the Association of American Railroads (AAR) Rail Time Indicators. Graphs and excerpts reprinted with permission.
As is usually the case, in September some rail sectors did better than others. There were clearly some good signs.
For example, U.S. intermodal originations in September 2023 averaged 252,224 containers and trailers per week, the most for any month since October 2022. August, September, and October are typically the highest-volume U.S. intermodal months, reflecting “peak season” shipments ahead of the holidays. In September, intermodal originations were up 0.7% over last year, just their second increase in 26 months. ...
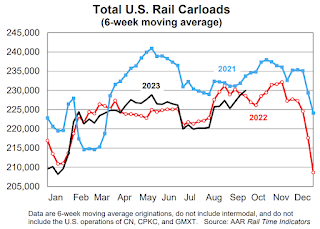
Total carloads on U.S. railroads in September 2023 were up 2.3% over September 2022, their first increase in four months and their biggest percentage gain since January 2023. Total carloads averaged 230,429 per week in September 2023, the most since October 2022. Year-to-date total carloads were up 0.3% over 2022 and up 0.7% over 2021
emphasis added
 Click on graph for larger image.
This graph from the Rail Time Indicators report shows the six-week average of U.S. Carloads in 2021, 2022 and 2022:
U.S. railroads originated 921,716 total carloads in September 2023, up 2.3% (20,754 carloads) over September 2022. That’s the first year-over-year increase for total carloads in four months and the biggest percentage increase since January 2023. Total carloads averaged 230,429 per week in September 2023, the most since October 2022. Intermodal isn’t included in carloads.
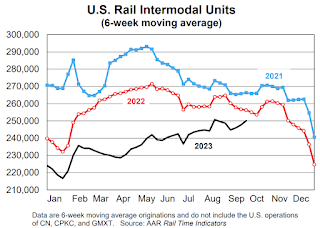 The second graph shows the six-week average (not monthly) of U.S. intermodal in 2021, 2022 and 2023: (using intermodal or shipping containers):
U.S. intermodal originations were up 0.7% in September 2023 over September 2022. That’s just the second year-over-year increase for intermodal since July 2021, a span of 26 months. (The other increase, in February 2022 over February 2021, shouldn’t count because it was a function of severe ice storms in February 2021 that caused an easy comparison when February 2022 came along.) U.S. intermodal volume in September 2023 averaged 252,224 containers and trailers per week, the most for any month since October 2022.


