 RSS Feed
 by Calculated Risk on 10/11/2023 08:16:00 PM
Wednesday, October 11, 2023
Thursday: CPI, Unemployment Claims
 Note: Mortgage rates are from MortgageNewsDaily.com and are for top tier scenarios.
Thursday:
• At 8:30 AM ET, The initial weekly unemployment claims report will be released. The consensus is for 208 thousand initial claims, up from 204 thousand last week.
• Also at 8:30 AM, The Consumer Price Index for September from the BLS. The consensus is for a 0.3% increase in CPI, and a 0.3% increase in core CPI. The consensus is for CPI to be up 3.6% year-over-year and core CPI to be up 4.1% YoY.
FOMC Minutes: "Majority of participants judged that one more increase in the target federal funds rate ... would likely be appropriate"
by Calculated Risk on 10/11/2023 02:04:00 PM
From the Fed: Minutes of the Federal Open Market Committee, September 19-20, 2023. Excerpt:
Participants noted that the data received over the past several months generally suggested that inflation was slowing. Even with these favorable developments, they emphasized that further progress was needed to get inflation sustainably to 2 percent. Participants pointed to the softening of price inflation for goods amid improving supply conditions and to declining housing services inflation. Several participants remarked that, despite the recent rise in energy prices, food and energy prices over the past year had contributed to a decline in overall inflation. However, participants also noted that significant progress in reducing inflation had yet to become apparent in the prices of core services excluding housing. Participants noted that longer-term inflation expectations remained well anchored and that shorter-term inflation expectations had been moving down from elevated levels. Participants observed that, notwithstanding recent favorable developments, inflation remained well above the Committee's 2 percent longer-run objective and that elevated inflation was continuing to harm businesses and households—particularly low-income households. Participants stressed that they would need to see more data indicating that inflation pressures were abating to be more confident that inflation was on course to return to 2 percent over time.
...
In discussing the policy outlook, participants continued to judge that it was critical that the stance of monetary policy be kept sufficiently restrictive to return inflation to the Committee's 2 percent objective over time. A majority of participants judged that one more increase in the target federal funds rate at a future meeting would likely be appropriate, while some judged it likely that no further increases would be warranted. All participants agreed that the Committee was in a position to proceed carefully and that policy decisions at every meeting would continue to be based on the totality of incoming information and its implications for the economic outlook as well as the balance of risks. Participants expected that the data arriving in coming months would help clarify the extent to which the disinflation process was continuing and labor markets were reaching a better balance between demand and supply. This information would be valuable in determining the extent of additional policy firming that may be appropriate to return inflation to 2 percent over time. Some participants also emphasized the importance of continuing to communicate clearly to the public about the Committee's data-dependent approach to policy and its firm commitment to bring inflation down to 2 percent.
emphasis added
2nd Look at Local Housing Markets in September
by Calculated Risk on 10/11/2023 11:34:00 AM
Today, in the Calculated Risk Real Estate Newsletter: 2nd Look at Local Housing Markets in September
A brief excerpt:
This is the second look at several early reporting local markets in September. I’m tracking about 40 local housing markets in the US. Some of the 40 markets are states, and some are metropolitan areas. I’ll update these tables throughout the month as additional data is released.There is much more in the article. You can subscribe at https://calculatedrisk.substack.com/
Closed sales in September were mostly for contracts signed in July and August. Since 30-year fixed mortgage rates were in the 6.8% range in July, and 7.1% in August, compared to the low-5% range the previous year, closed sales were down year-over-year in September.
...
Note: Sales in Jacksonville were up YoY. This is because sales were depressed in September 2022 by Hurricane Ian. Sales in other areas of Florida will also likely be up YoY.
In September, sales in these markets were down 20.6%. In August, these same markets were down 14.6% YoY Not Seasonally Adjusted (NSA).
This is a larger YoY decline NSA than in August for these early reporting markets. However, there was one less working day in September 2023 compared to September 2022. So, seasonally adjusted, the decline will not be quite as large. ... This early data suggests the September existing home sales report will show another significant YoY decline, perhaps to around 3.8 to 3.9 million (an early guess), and below the previous cycle low of 4.00 million in January 2023. This will be the 25th consecutive month with a YoY decline in sales.
...
Many more local markets to come!

MBA: Mortgage Applications Increased in Weekly Survey
by Calculated Risk on 10/11/2023 07:00:00 AM
From the MBA: Mortgage Applications Increase in Latest MBA Weekly Survey
Mortgage applications increased 0.6 percent from one week earlier, according to data from the Mortgage Bankers Association’s (MBA) Weekly Mortgage Applications Survey for the week ending October 6, 2023.
The Market Composite Index, a measure of mortgage loan application volume, increased 0.6 percent on a seasonally adjusted basis from one week earlier. On an unadjusted basis, the Index increased 1 percent compared with the previous week. The Refinance Index increased 0.3 percent from the previous week and was 9 percent lower than the same week one year ago. The seasonally adjusted Purchase Index increased 1 percent from one week earlier. The unadjusted Purchase Index increased 1 percent compared with the previous week and was 19 percent lower than the same week one year ago.
“While most mortgage rates increased last week, rates on ARMs declined, leading to an increase in ARM volume and an increase in overall applications. The level of ARM applications increased by 15 percent over the week, bringing the ARM share up to 9.2 percent of all applications, the highest share since November 2022. The yield curve has become less inverted in recent weeks and ARM pricing has certainly improved,” said Joel Kan, MBA’s Vice President and Deputy Chief Economist. “The 30-year fixed mortgage rate is at 7.67 percent – the highest level since 2000 and 40 basis points higher than a month ago. Application activity remains depressed and close to multi-decade lows, with purchase applications still almost 20 percent behind last year’s pace. Refinance applications also continue to be limited, and the average loan size has fallen to its lowest level since 2017.”
...
The average contract interest rate for 30-year fixed-rate mortgages with conforming loan balances ($726,200 or less) increased to 7.67 percent from 7.53 percent, with points decreasing to 0.75 from 0.80 (including the origination fee) for 80 percent loan-to-value ratio (LTV) loans.
emphasis added
 Click on graph for larger image.
The first graph shows the MBA mortgage purchase index.
According to the MBA, purchase activity is down 19% year-over-year unadjusted.
Red is a four-week average (blue is weekly). The 4-week average is at the lowest level since 1995.

The second graph shows the refinance index since 1990.
With higher mortgage rates, the refinance index declined sharply in 2022 - and has mostly flat lined at a low level since then.
Tuesday, October 10, 2023
Wednesday: PPI, FOMC Minutes
by Calculated Risk on 10/10/2023 07:31:00 PM
 From Matthew Graham at Mortgage News Daily: Mortgage Rates Sharply Lower
The average mortgage lender is quoting a top tier 30yr fixed mortgage rate that is nearly a quarter of a percent lower than the same scenario last Friday. Granted, big moves like this are more common after hitting multi-decade highs, bit today's example has other motivations.Wednesday:
Specifically, the outbreak of the Israel-Gaza conflict prompted some excess demand for safer haven assets like US Treasuries and mortgage-backed securities. Perhaps more importantly the conflict creates geopolitical uncertainty that is seen as one more reason for the Fed to "wait and see" when it comes time to decide whether to hike rates one more time in 2023 or not. [30 year fixed 7.62%]
emphasis added
• At 7:00 AM ET, The Mortgage Bankers Association (MBA) will release the results for the mortgage purchase applications index.
• At 8:30 AM, The Producer Price Index for September from the BLS. The consensus is for a 0.3% increase in PPI, and a 0.2% increase in core PPI.
• At 2:00 PM, FOMC Minutes, Minutes Meeting of September 19-20, 2023
More Employment Graphs: Duration of Unemployment, Unemployment by Education, Diffusion Indexes
by Calculated Risk on 10/10/2023 12:45:00 PM
A few more employment graphs ...
 Click on graph for larger image.
This graph shows the duration of unemployment as a percent of the civilian labor force. The graph shows the number of unemployed in four categories: less than 5 week, 6 to 14 weeks, 15 to 26 weeks, and 27 weeks or more.
The short-term categories peaked at over 9% of the labor force at the onset of the pandemic.
The duration of unemployment was much shorter during the pandemic than during the housing bust / financial crisis. In general, all categories are at normal levels.
Unemployment by Education
 This graph shows the unemployment rate by four levels of education (all groups are 25 years and older).
Unfortunately, this data only goes back to 1992 and includes only three recessions (the stock / tech bust in 2001, and the housing bust/financial crisis, and the 2020 pandemic). Clearly education matters with regards to the unemployment rate, with the lowest rate for college graduates at 2.1% in September, and highest for those without a high school degree at 5.5% in September.
All four groups were generally trending down prior to the pandemic. And all are close to pre-pandemic levels now.
Note: This says nothing about the quality of jobs - as an example, a college graduate working at minimum wage would be considered "employed".
Diffusion Indexes
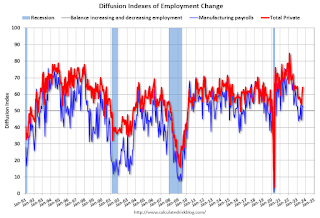 The BLS diffusion index for total private employment was at 64.2 in September, up from 62.2 in August. A solid reading.
For manufacturing, the diffusion index was at 52.8, unchanged from 52.8 in August.
Think of this as a measure of how widespread job gains are across industries. The further from 50 (above or below), the more widespread the job losses or gains reported by the BLS. Above 60 is very good. From the BLS:
 This graph shows the unemployment rate by four levels of education (all groups are 25 years and older).
Unfortunately, this data only goes back to 1992 and includes only three recessions (the stock / tech bust in 2001, and the housing bust/financial crisis, and the 2020 pandemic). Clearly education matters with regards to the unemployment rate, with the lowest rate for college graduates at 2.1% in September, and highest for those without a high school degree at 5.5% in September.
All four groups were generally trending down prior to the pandemic. And all are close to pre-pandemic levels now.
Note: This says nothing about the quality of jobs - as an example, a college graduate working at minimum wage would be considered "employed".
 The BLS diffusion index for total private employment was at 64.2 in September, up from 62.2 in August. A solid reading.
For manufacturing, the diffusion index was at 52.8, unchanged from 52.8 in August.
Think of this as a measure of how widespread job gains are across industries. The further from 50 (above or below), the more widespread the job losses or gains reported by the BLS. Above 60 is very good. From the BLS:
Figures are the percent of industries with employment increasing plus one-half of the industries with unchanged employment, where 50 percent indicates an equal balance between industries with increasing and decreasing employment.Overall private job growth was widespread in September.
Part 2: Current State of the Housing Market; Overview for mid-October
by Calculated Risk on 10/10/2023 09:21:00 AM
Today, in the Calculated Risk Real Estate Newsletter: Part 2: Current State of the Housing Market; Overview for mid-October
A brief excerpt:
Yesterday, in Part 1: Current State of the Housing Market; Overview for mid-October I reviewed home inventory and sales.There is much more in the article. You can subscribe at https://calculatedrisk.substack.com/
...
Most measures of house prices have shown an increase in prices over the last several months, and a key question I discussed in July is Will house prices decline further later this year? I will revisit this question soon.
Other measures of house prices suggest prices will be up further YoY over the next few months in the Case-Shiller index. The NAR reported median prices were up 3.9% YoY in August, up from 1.7% YoY in July. ICE / Black Knight reported prices were up 3.8% YoY in August, up from 2.4% YoY in July to new all-time highs, and Freddie Mac reported house prices were up 4.0% YoY in August, up from 2.9% YoY in July - and also to new all-time highs.
Here is a comparison of year-over-year change in the FMHPI, median house prices from the NAR, and the Case-Shiller National index.
The FMHPI and the NAR median prices appear to be leading indicators for Case-Shiller. Based on recent monthly data, and the FMHPI, the YoY change in the Case-Shiller index will increase further in the report for August.

Monday, October 09, 2023
Moody's: Mall Vacancy Rate Unchanged in Q3
by Calculated Risk on 10/09/2023 03:49:00 PM
Note: I covered apartments and offices in the newsletter: Moody's: "Apartment Market Softens, Office Evolution Continues, and Retail On Shaky Ground"
From Moody’s Analytics economists Thomas Lasalvia, Lu Chen and Nick Luettke: Apartment Market Softens, Office Evolution Continues, and Retail On Shaky Ground
Over the past decade, traditional retail forms have been challenged by e-commerce’s boom, whose share as a percentage of total retail sales has been constantly hovering above 15% since early 2023. During the sector’s ongoing revolution, retail clusters have been shifting towards service-centric and experience-oriented uses. As non-performing assets get replaced by modernized retail forms or even mixed-use communities, the retail sector ignited a long-awaited hope at the rise of pent-up consumer demand.
...
[N]eighborhood and community shopping centers held steady for another quarter. But over 85,000 sqft of net move-ins fell well under the verified new retail completions, totaling 390,000 sqft over the last three months. August and September leasing activities showed some cracks but it may still be too early to call it systematic. National vacancy stayed flat at 10.3% since early 2023. Asking/effective rents were up slightly by 0.2%/0.3% as compared to last quarter but remained in the $21/$18-per-sqft range, a level relatively unchanged since 2018.
 This graph shows the strip mall vacancy rate starting in 1980 (prior to 2000 the data is annual).
 Back in the '80s, there was overbuilding in the mall sector even as the vacancy rate was rising. This was due to the very loose commercial lending that led to the S&L crisis.
In the mid-'00s, mall investment picked up as mall builders followed the "roof tops" of the residential boom (more loose lending). This led to the vacancy rate moving higher even before the recession started. Then there was a sharp increase in the vacancy rate during the recession and financial crisis.
In the mid-'00s, mall investment picked up as mall builders followed the "roof tops" of the residential boom (more loose lending). This led to the vacancy rate moving higher even before the recession started. Then there was a sharp increase in the vacancy rate during the recession and financial crisis.
Effective rents have been mostly unchanged for strip malls for 4+ years.
Part 1: Current State of the Housing Market; Overview for mid-October
by Calculated Risk on 10/09/2023 12:02:00 PM
Today, in the Calculated Risk Real Estate Newsletter: Part 1: Current State of the Housing Market; Overview for mid-October
A brief excerpt:
The NAR reported sales were at a “seasonally adjusted annual rate of 4.04 million in August. Year-over-year, sales fell 15.3% (down from 4.77 million in August 2022).” This was in line with the local markets I tracked for August.There is much more in the article. You can subscribe at https://calculatedrisk.substack.com/
The current cycle low for existing home sales was 4.00 million SAAR in January 2023. The early local market reports suggest a new cycle low for closed sales in September!
Usually, house prices bottom after sales bottom, so a new cycle low for sales suggests likely further weakness for house prices in coming months. I’ll have more on this pattern.

Housing October 9th Weekly Update: Inventory increased 0.4% Week-over-week; Down 4.3% Year-over-year
by Calculated Risk on 10/09/2023 08:11:00 AM
Altos reports that active single-family inventory was up 0.4% week-over-week.
 Click on graph for larger image.
This inventory graph is courtesy of Altos Research.
As of October 6th, inventory was at 537 thousand (7-day average), compared to 535 thousand the prior week.
Year-to-date, inventory is up 9.4%. And inventory is up 32.4% from the seasonal bottom 25 weeks ago.

The red line is for 2023. The black line is for 2019. Note that inventory is up from the record low for the same week in 2021, but below last year and still well below normal levels.
Inventory was down 4.3% compared to the same week in 2022 (last week it was down 4.7%), and down 43.8% compared to the same week in 2019 (last week down 43.9%).
In 2022, inventory didn't peak until late October, and it appears likely same week inventory will be below 2022 levels for the remainder of the year - depending on when inventory finally peaks this year!
It also seems likely that inventory will be close to or above 2020 levels (dark blue line) by the end of the year.
Mike Simonsen discusses this data regularly on Youtube.


