 RSS Feed
 by Calculated Risk on 10/13/2023 08:11:00 AM
Friday, October 13, 2023
Realtor.com Reports Weekly Active Inventory Down 2.4% YoY; New Listings Down 3.2% YoY
Realtor.com has monthly and weekly data on the existing home market. Here is their weekly report from Sabrina Speianu: Weekly Housing Trends View — Data Week Ending Oct 7, 2023
• Active inventory declined, with for-sale homes lagging behind year ago levels by 2.4%.
During the past week, we observed the 16th successive drop in the number of homes available for sale when compared to the previous year. This decline showed a slight improvement compared to the previous week’s -2.6% figure and inventory has been growing week-to-week over September and into October. However, despite this marginal improvement, inventory remained tight and came in 45.1% below typical pre-pandemic levels in September.
• New listings–a measure of sellers putting homes up for sale–were down again this week, by 3.2% from one year ago. .
For more than a year we have seen a consistent decline in the number of newly listed homes compared to the same period in the previous year. This past week, the gap compared to last year remains low as new listings were only 3.2% lower. However, last year’s pace of new listings was already historically low due to a steady rise in mortgage rates at that time. While this autumn’s listing pace is expected to catch up to last year, it is still notably much lower than pre-pandemic levels as we expect homeowners to continue to feel “locked-in” by mortgage rates ...
 Here is a graph of the year-over-year change in inventory according to realtor.com.
 Inventory was down 3.2% year-over-year - this was the sixteenth consecutive week with a YoY decrease following 58 consecutive weeks with a YoY increase in inventory.
The YoY decline in inventory has been getting smaller recently but will likely stay down YoY for the remainder of 2023 since inventory was increasing late into the year last year.
New listings really collapsed a year ago, so the YoY comparison for new listings is easier now - and new listings are still historically very low.
Thursday, October 12, 2023
YoY Measures of Inflation: Services, Goods and Shelter
by Calculated Risk on 10/12/2023 02:50:00 PM
Here are a few measures of inflation:
The first graph is the one Fed Chair Powell had mentioned earlier when services less rent of shelter was up 7.6% year-over-year. This has fallen sharply and is now up 2.8% YoY.
 Click on graph for larger image.
This graph shows the YoY price change for Services and Services less rent of shelter through September 2023.
Services were up 5.2% YoY as of September 2023, down from 5.4% YoY in August.
Services less rent of shelter was up 2.8% YoY in August, down from 3.1% YoY in August.
Services less rent of shelter was up 2.8% YoY in August, down from 3.1% YoY in August.
Earlier this year, a key question was: Would services ex-shelter inflation be persistent, or would it follow a similar pattern as goods? This is a topic I discussed in Pandemic Economics, Housing and Monetary Policy: Part 2.
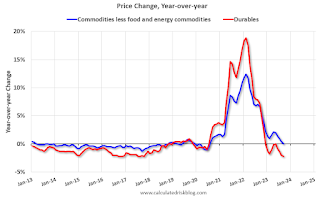 The second graph shows that goods prices started to increase year-over-year (YoY) in 2020 and accelerated in 2021 due to both strong demand and supply chain disruptions.
The second graph shows that goods prices started to increase year-over-year (YoY) in 2020 and accelerated in 2021 due to both strong demand and supply chain disruptions.Durables were at -2.2% YoY as of September 2023, down from -2.0% YoY in August.
Commodities less food and energy commodities were unchanged YoY in September, down from 0.4% YoY in August.
Commodities less food and energy commodities were unchanged YoY in September, down from 0.4% YoY in August.
Goods inflation was transitory.
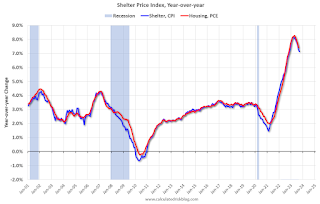 Here is a graph of the year-over-year change in shelter from the CPI report (through August) and housing from the PCE report (through July 2023)
Shelter was up 7.1% year-over-year in September, down from 7.2% in August. Housing (PCE) was up 7.4% YoY in August, down from 7.7% in July.
The BLS noted this morning: "The index for shelter was the largest contributor to the monthly all items increase, accounting for over half of the increase."
Core CPI ex-shelter was up 1.9% YoY in September, down from 2.3% in August.
Cleveland Fed: Median CPI increased 0.5% and Trimmed-mean CPI increased 0.4% in September
by Calculated Risk on 10/12/2023 11:22:00 AM
The Cleveland Fed released the median CPI and the trimmed-mean CPI.
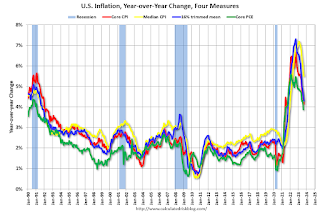
According to the Federal Reserve Bank of Cleveland, the median Consumer Price Index rose 0.5% in September. The 16% trimmed-mean Consumer Price Index increased 0.4% in September. "The median CPI and 16% trimmed-mean CPI are measures of core inflation calculated by the Federal Reserve Bank of Cleveland based on data released in the Bureau of Labor Statistics’ (BLS) monthly CPI report".
 Click on graph for larger image.
This graph shows the year-over-year change for these four key measures of inflation.
Note: The Cleveland Fed released the median CPI details. "Fuel oil and other fuels" increased at a 76% annualized rate in September, and "Lodging away from home" increased at a 54% annualized rate.
According to the Federal Reserve Bank of Cleveland, the median Consumer Price Index rose 0.5% in September. The 16% trimmed-mean Consumer Price Index increased 0.4% in September. "The median CPI and 16% trimmed-mean CPI are measures of core inflation calculated by the Federal Reserve Bank of Cleveland based on data released in the Bureau of Labor Statistics’ (BLS) monthly CPI report".
 Click on graph for larger image.
This graph shows the year-over-year change for these four key measures of inflation.
On a year-over-year basis, the median CPI rose 5.5% (down from 5.7% in August), the trimmed-mean CPI rose 4.3% (down from 4.5%), and the CPI less food and energy rose 4.1% (down from 4.3%).
Core PCE is for August was up 3.9% YoY, down from 4.2% in July.
Note: The Cleveland Fed released the median CPI details. "Fuel oil and other fuels" increased at a 76% annualized rate in September, and "Lodging away from home" increased at a 54% annualized rate.
Cost of Living Adjustment increases 3.2% in 2024, Contribution Base increased to $168,600
by Calculated Risk on 10/12/2023 08:59:00 AM
With the release of the CPI report this morning, we now know the Cost of Living Adjustment (COLA), and the contribution base for 2024.
From Social Security: Social Security Announces 3.2 Percent Benefit Increase for 2024
Social Security and Supplemental Security Income (SSI) benefits for more than 71 million Americans will increase 3.2 percent in 2024, the Social Security Administration announced today. On average, Social Security retirement benefits will increase by more than $50 per month starting in January.Currently CPI-W is the index that is used to calculate the Cost-Of-Living Adjustments (COLA). Here is a discussion from Social Security on the current calculation (3.2% increase) and a list of previous Cost-of-Living Adjustments.
...
Some other adjustments that take effect in January of each year are based on the increase in average wages. Based on that increase, the maximum amount of earnings subject to the Social Security tax (taxable maximum) will increase to $168,600 from $160,200.
The contribution and benefit base will be $168,600 in 2024.
The National Average Wage Index increased to $63,795.13 in 2022, up 5.3% from $60,575.07 in 2021 (used to calculate contribution base).
BLS: CPI increased 0.4% in September; Core CPI increased 0.3%
by Calculated Risk on 10/12/2023 08:31:00 AM
The Consumer Price Index for All Urban Consumers (CPI-U) rose 0.4 percent in September on a seasonally adjusted basis, after increasing 0.6 percent in August, the U.S. Bureau of Labor Statistics reported today. Over the last 12 months, the all items index increased 3.7 percent before seasonal adjustment.CPI was slightly above expectations and core CPI was at expectations. I'll post a graph later today after the Cleveland Fed releases the median and trimmed-mean CPI.
The index for shelter was the largest contributor to the monthly all items increase, accounting for over half of the increase. An increase in the gasoline index was also a major contributor to the all items monthly rise. While the major energy component indexes were mixed in September, the energy index rose 1.5 percent over the month. The food index increased 0.2 percent in September, as it did in the previous two months. The index for food at home increased 0.1 percent over the month while the index for food away from home rose 0.4 percent.
The index for all items less food and energy rose 0.3 percent in September, the same increase as in August. Indexes which increased in September include rent, owners' equivalent rent, lodging away from home, motor vehicle insurance, recreation, personal care, and new vehicles. The indexes for used cars and trucks and for apparel were among those that decreased over the month.
The all items index increased 3.7 percent for the 12 months ending September, the same increase as the 12 months ending in August. The all items less food and energy index rose 4.1 percent over the last 12 months. The energy index decreased 0.5 percent for the 12 months ending September, and the food index increased 3.7 percent over the last year.
emphasis added
Weekly Initial Unemployment Claims Unchanged at 209,000
by Calculated Risk on 10/12/2023 08:30:00 AM
The DOL reported:
In the week ending October 7, the advance figure for seasonally adjusted initial claims was 209,000, unchanged from the previous week's revised level. The previous week's level was revised up by 2,000 from 207,000 to 209,000. The 4-week moving average was 206,250, a decrease of 3,000 from the previous week's revised average. The previous week's average was revised up by 500 from 208,750 to 209,250.The following graph shows the 4-week moving average of weekly claims since 1971.
emphasis added
 Click on graph for larger image.
The dashed line on the graph is the current 4-week average. The four-week average of weekly unemployment claims decreased to 206,250.
The previous week was revised up.
Weekly claims were close to the consensus forecast.
Wednesday, October 11, 2023
Thursday: CPI, Unemployment Claims
by Calculated Risk on 10/11/2023 08:16:00 PM
 Note: Mortgage rates are from MortgageNewsDaily.com and are for top tier scenarios.
Thursday:
• At 8:30 AM ET, The initial weekly unemployment claims report will be released. The consensus is for 208 thousand initial claims, up from 204 thousand last week.
• Also at 8:30 AM, The Consumer Price Index for September from the BLS. The consensus is for a 0.3% increase in CPI, and a 0.3% increase in core CPI. The consensus is for CPI to be up 3.6% year-over-year and core CPI to be up 4.1% YoY.
FOMC Minutes: "Majority of participants judged that one more increase in the target federal funds rate ... would likely be appropriate"
by Calculated Risk on 10/11/2023 02:04:00 PM
From the Fed: Minutes of the Federal Open Market Committee, September 19-20, 2023. Excerpt:
Participants noted that the data received over the past several months generally suggested that inflation was slowing. Even with these favorable developments, they emphasized that further progress was needed to get inflation sustainably to 2 percent. Participants pointed to the softening of price inflation for goods amid improving supply conditions and to declining housing services inflation. Several participants remarked that, despite the recent rise in energy prices, food and energy prices over the past year had contributed to a decline in overall inflation. However, participants also noted that significant progress in reducing inflation had yet to become apparent in the prices of core services excluding housing. Participants noted that longer-term inflation expectations remained well anchored and that shorter-term inflation expectations had been moving down from elevated levels. Participants observed that, notwithstanding recent favorable developments, inflation remained well above the Committee's 2 percent longer-run objective and that elevated inflation was continuing to harm businesses and households—particularly low-income households. Participants stressed that they would need to see more data indicating that inflation pressures were abating to be more confident that inflation was on course to return to 2 percent over time.
...
In discussing the policy outlook, participants continued to judge that it was critical that the stance of monetary policy be kept sufficiently restrictive to return inflation to the Committee's 2 percent objective over time. A majority of participants judged that one more increase in the target federal funds rate at a future meeting would likely be appropriate, while some judged it likely that no further increases would be warranted. All participants agreed that the Committee was in a position to proceed carefully and that policy decisions at every meeting would continue to be based on the totality of incoming information and its implications for the economic outlook as well as the balance of risks. Participants expected that the data arriving in coming months would help clarify the extent to which the disinflation process was continuing and labor markets were reaching a better balance between demand and supply. This information would be valuable in determining the extent of additional policy firming that may be appropriate to return inflation to 2 percent over time. Some participants also emphasized the importance of continuing to communicate clearly to the public about the Committee's data-dependent approach to policy and its firm commitment to bring inflation down to 2 percent.
emphasis added
2nd Look at Local Housing Markets in September
by Calculated Risk on 10/11/2023 11:34:00 AM
Today, in the Calculated Risk Real Estate Newsletter: 2nd Look at Local Housing Markets in September
A brief excerpt:
This is the second look at several early reporting local markets in September. I’m tracking about 40 local housing markets in the US. Some of the 40 markets are states, and some are metropolitan areas. I’ll update these tables throughout the month as additional data is released.There is much more in the article. You can subscribe at https://calculatedrisk.substack.com/
Closed sales in September were mostly for contracts signed in July and August. Since 30-year fixed mortgage rates were in the 6.8% range in July, and 7.1% in August, compared to the low-5% range the previous year, closed sales were down year-over-year in September.
...
Note: Sales in Jacksonville were up YoY. This is because sales were depressed in September 2022 by Hurricane Ian. Sales in other areas of Florida will also likely be up YoY.
In September, sales in these markets were down 20.6%. In August, these same markets were down 14.6% YoY Not Seasonally Adjusted (NSA).
This is a larger YoY decline NSA than in August for these early reporting markets. However, there was one less working day in September 2023 compared to September 2022. So, seasonally adjusted, the decline will not be quite as large. ... This early data suggests the September existing home sales report will show another significant YoY decline, perhaps to around 3.8 to 3.9 million (an early guess), and below the previous cycle low of 4.00 million in January 2023. This will be the 25th consecutive month with a YoY decline in sales.
...
Many more local markets to come!

MBA: Mortgage Applications Increased in Weekly Survey
by Calculated Risk on 10/11/2023 07:00:00 AM
From the MBA: Mortgage Applications Increase in Latest MBA Weekly Survey
Mortgage applications increased 0.6 percent from one week earlier, according to data from the Mortgage Bankers Association’s (MBA) Weekly Mortgage Applications Survey for the week ending October 6, 2023.
The Market Composite Index, a measure of mortgage loan application volume, increased 0.6 percent on a seasonally adjusted basis from one week earlier. On an unadjusted basis, the Index increased 1 percent compared with the previous week. The Refinance Index increased 0.3 percent from the previous week and was 9 percent lower than the same week one year ago. The seasonally adjusted Purchase Index increased 1 percent from one week earlier. The unadjusted Purchase Index increased 1 percent compared with the previous week and was 19 percent lower than the same week one year ago.
“While most mortgage rates increased last week, rates on ARMs declined, leading to an increase in ARM volume and an increase in overall applications. The level of ARM applications increased by 15 percent over the week, bringing the ARM share up to 9.2 percent of all applications, the highest share since November 2022. The yield curve has become less inverted in recent weeks and ARM pricing has certainly improved,” said Joel Kan, MBA’s Vice President and Deputy Chief Economist. “The 30-year fixed mortgage rate is at 7.67 percent – the highest level since 2000 and 40 basis points higher than a month ago. Application activity remains depressed and close to multi-decade lows, with purchase applications still almost 20 percent behind last year’s pace. Refinance applications also continue to be limited, and the average loan size has fallen to its lowest level since 2017.”
...
The average contract interest rate for 30-year fixed-rate mortgages with conforming loan balances ($726,200 or less) increased to 7.67 percent from 7.53 percent, with points decreasing to 0.75 from 0.80 (including the origination fee) for 80 percent loan-to-value ratio (LTV) loans.
emphasis added
 Click on graph for larger image.
The first graph shows the MBA mortgage purchase index.
According to the MBA, purchase activity is down 19% year-over-year unadjusted.
Red is a four-week average (blue is weekly). The 4-week average is at the lowest level since 1995.

The second graph shows the refinance index since 1990.
With higher mortgage rates, the refinance index declined sharply in 2022 - and has mostly flat lined at a low level since then.


