 RSS Feed
 by Calculated Risk on 10/15/2023 09:41:00 AM
Sunday, October 15, 2023
By Request: Public and Private Sector Payroll Jobs During Presidential Terms
Note: I used to post this monthly, but I stopped during the COVID-19 pandemic. I've received a number of requests lately to post this again, so here is another update of tracking employment during Presidential terms. We frequently use Presidential terms as time markers - we could use Speaker of the House, Fed Chair, or any other marker.
Important: There are many differences between these periods. Overall employment was smaller in the '80s, however the participation rate was increasing in the '80s (younger population and women joining the labor force), and the participation rate is generally declining now. But these graphs give an overview of employment changes.
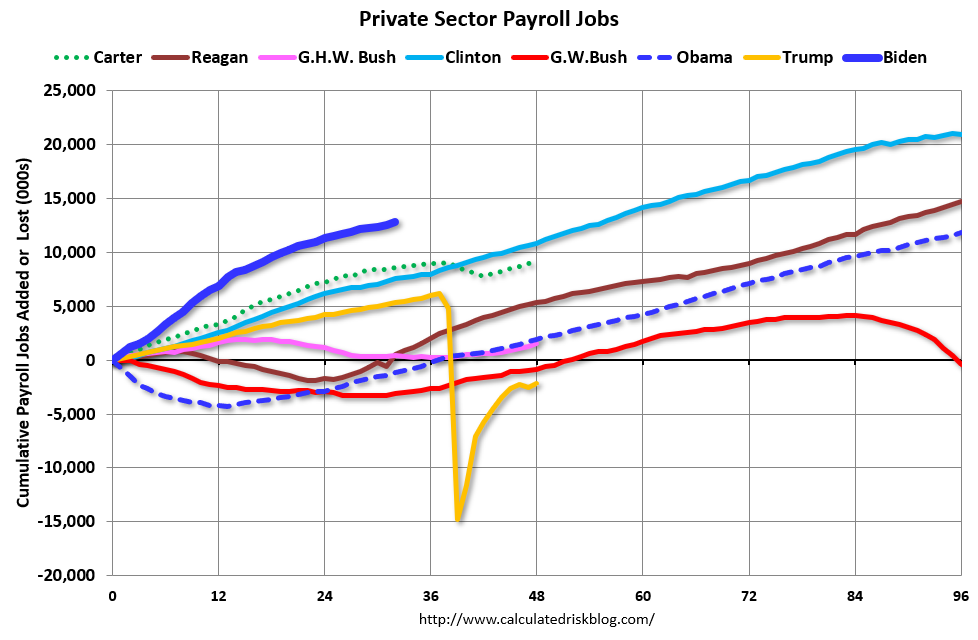
The first graph shows the change in private sector payroll jobs from when each president took office until the end of their term(s). Presidents Carter, George H.W. Bush and Trump only served one term.
Mr. G.W. Bush (red) took office following the bursting of the stock market bubble and left during the bursting of the housing bubble. Mr. Obama (dark blue) took office during the financial crisis and great recession. There was also a significant recession in the early '80s right after Mr. Reagan (dark red) took office.
There was a recession towards the end of President G.H.W. Bush (light purple) term, and Mr. Clinton (light blue) served for eight years without a recession. And there was a pandemic related recession in 2020.
First, here is a table for private sector jobs. The top two previous private sector terms were both under President Clinton.
| Term | Private Sector Jobs Added (000s) |
|---|---|
| Carter | 9,039 |
| Reagan 1 | 5,363 |
| Reagan 2 | 9,351 |
| GHW Bush | 1,511 |
| Clinton 1 | 10,877 |
| Clinton 2 | 10,093 |
| GW Bush 1 | -820 |
| GW Bush 2 | 447 |
| Obama 1 | 1,906 |
| Obama 2 | 9,927 |
| Trump | -2,135 |
| Biden | 12,8241 |
| 1After 32 months. | |
 Click on graph for larger image.
The first graph is for private employment only.
The employment recovery during Mr. G.W. Bush's (red) first term was sluggish, and private employment was down 820,000 jobs at the end of his first term. At the end of Mr. Bush's second term, private employment was collapsing, and there were net 373,000 private sector jobs lost during Mr. Bush's two terms.
Private sector employment increased by 9,039,000 under President Carter (dashed green), by 14,714,000 under President Reagan (dark red), 1,511,000 under President G.H.W. Bush (light purple), 20,970,000 under President Clinton (light blue), and 11,833,000 under President Obama (dark dashed blue). During Trump's term (Orange), the economy lost 2,135,000 private sector jobs.
In the first 32 months of President Biden's term (Blue), the economy has added 12,824,000 private sector jobs, as the economy recovered from the pandemic.
 A big difference between the presidencies has been public sector employment. Note: the bumps in public sector employment due to the decennial Census in 1980, 1990, 2000, 2010 and 2020.
The public sector grew during Mr. Carter's term (up 1,304,000), during Mr. Reagan's terms (up 1,414,000), during Mr. G.H.W. Bush's term (up 1,127,000), during Mr. Clinton's terms (up 1,934,000), and during Mr. G.W. Bush's terms (up 1,744,000 jobs). However, the public sector declined significantly while Mr. Obama was in office (down 271,000 jobs). During Trump's term, the economy lost 535,000 public sector jobs.
 A big difference between the presidencies has been public sector employment. Note: the bumps in public sector employment due to the decennial Census in 1980, 1990, 2000, 2010 and 2020.
 The public sector grew during Mr. Carter's term (up 1,304,000), during Mr. Reagan's terms (up 1,414,000), during Mr. G.H.W. Bush's term (up 1,127,000), during Mr. Clinton's terms (up 1,934,000), and during Mr. G.W. Bush's terms (up 1,744,000 jobs). However, the public sector declined significantly while Mr. Obama was in office (down 271,000 jobs). During Trump's term, the economy lost 535,000 public sector jobs.
In the first 32 months of President Biden's term, the economy has added 1,081,000 public sector jobs (about 94% of public job growth has been for state and local governments, and about 60% for education).
| Term | Public Sector Jobs Added (000s) |
|---|---|
| Carter | 1,304 |
| Reagan 1 | -24 |
| Reagan 2 | 1,438 |
| GHW Bush | 1,127 |
| Clinton 1 | 692 |
| Clinton 2 | 1,242 |
| GW Bush 1 | 900 |
| GW Bush 2 | 844 |
| Obama 1 | -710 |
| Obama 2 | 447 |
| Trump | -535 |
| Biden | 1,0811 |
| 1After 32 months. | |
Saturday, October 14, 2023
Real Estate Newsletter Articles this Week: Current State of the Housing Market
by Calculated Risk on 10/14/2023 02:11:00 PM
At the Calculated Risk Real Estate Newsletter this week:
• Part 1: Current State of the Housing Market; Overview for mid-October
• Part 2: Current State of the Housing Market; Overview for mid-October
• 3rd Look at Local Housing Markets in September
• 2nd Look at Local Housing Markets in September
This is usually published 4 to 6 times a week and provides more in-depth analysis of the housing market.
You can subscribe at https://calculatedrisk.substack.com/
Schedule for Week of October 15, 2023
by Calculated Risk on 10/14/2023 08:11:00 AM
The key economic reports this week are September Retail Sales, Housing Starts and Existing Home sales.
For manufacturing, September Industrial Production, and the October New York and Philly Fed surveys will be released this week.
8:30 AM ET: The New York Fed Empire State manufacturing survey for October. The consensus is for a reading of -1.5, down from 1.9.
 8:30 AM ET: Retail sales for September will be released. The consensus is for a 0.2% increase in retail sales.
This graph shows retail sales since 1992. This is monthly retail sales and food service, seasonally adjusted (total and ex-gasoline).
 9:15 AM: The Fed will release Industrial Production and Capacity Utilization for September.
This graph shows industrial production since 1967.
The consensus is for a 0.1% increase in Industrial Production, and for Capacity Utilization to decrease to 79.6%.
10:00 AM: The October NAHB homebuilder survey. The consensus is for a reading of 44, down from 45 in September. Any number below 50 indicates that more builders view sales conditions as poor than good.
7:00 AM ET: The Mortgage Bankers Association (MBA) will release the results for the mortgage purchase applications index.
 8:30 AM: Housing Starts for September.
 This graph shows single and multi-family housing starts since 1968.
The consensus is for 1.405 million SAAR, up from 1.283 million SAAR.
During the day: The AIA/Deltek's Architecture Billings Index for September (a leading indicator for commercial real estate).
2:00 PM: the Federal Reserve Beige Book, an informal review by the Federal Reserve Banks of current economic conditions in their Districts.
8:30 AM: The initial weekly unemployment claims report will be released. The consensus is for 210 thousand initial claims, up from 209 thousand last week.
8:30 AM: the Philly Fed manufacturing survey for October. The consensus is for a reading of -6.8, up from -13.5.
 10:00 AM: Existing Home Sales for September from the National Association of Realtors (NAR). The consensus is for 3.94 million SAAR, down from 4.04 million in August.
The graph shows existing home sales from 1994 through the report last month.
12:00 PM: Discussion, Fed Chair Jerome Powell, Economic Outlook, At the Economic Club of New York (ECNY) Luncheon, New York, New York
10:00 AM: State Employment and Unemployment (Monthly) for September 2023
Friday, October 13, 2023
Oct 13th COVID Update: Deaths and Hospitalizations Decreased
by Calculated Risk on 10/13/2023 07:16:00 PM
 Note: Mortgage rates are from MortgageNewsDaily.com and are for top tier scenarios.
Due to changes at the CDC, weekly cases are no longer updated.
For deaths, I'm currently using 3 weeks ago for "now", since the most recent two weeks will be revised significantly.
Recently hospitalizations have almost tripled from a low of 5,150 in June 2023. Hospitalizations are far below the peak of 150,000 in January 2022.
| COVID Metrics | ||||
|---|---|---|---|---|
| Now | Week Ago | Goal | ||
| Hospitalized2 | 14,509 | 15,697 | ≤3,0001 | |
| Deaths per Week2 | 1,217 | 1,274 | ≤3501 | |
| 1my goals to stop weekly posts, 2Weekly for Currently Hospitalized, and Deaths 🚩 Increasing number weekly for Hospitalized and Deaths ✅ Goal met. | ||||
 Click on graph for larger image.
This graph shows the weekly (columns) number of deaths reported.
Weekly deaths have more than doubled from a low of 469 in early July. Weekly deaths are far below the weekly peak of 26,000 in January 2021.
Q3 GDP Tracking: High 3s
by Calculated Risk on 10/13/2023 02:10:00 PM
From BofA:
Overall, the data flow since our last weekly pushed up our 3Q US GDP tracking estimate from 3.7% to 3.8% q/q saar. [Oct 13th estimate]From Goldman:
emphasis added
We left our Q3 GDP tracking estimate unchanged at +3.7% (qoq ar) and our domestic final sales growth forecast also unchanged at +2.4%. [Oct 10th estimate]And from the Altanta Fed: GDPNow
The GDPNow model estimate for real GDP growth (seasonally adjusted annual rate) in the third quarter of 2023 is 5.1 percent on October 10, up from 4.9 percent on October 5. [Oct 10th estimate]
3rd Look at Local Housing Markets in September
by Calculated Risk on 10/13/2023 01:43:00 PM
Today, in the Calculated Risk Real Estate Newsletter: 3rd Look at Local Housing Markets in September
A brief excerpt:
Note: The National Association of Realtors (NAR) is scheduled to release September existing home sales next week on Thursday, October 19th, at 10:00 AM ET. The consensus is the NAR will report sales of 3.94 million SAAR, down from 4.04 million in August. This would be a new cycle low, below the 4.00 million SAAR in January 2023.There is much more in the article. You can subscribe at https://calculatedrisk.substack.com/
This is the third look at local markets in September. I’m tracking about 40 local housing markets in the US. Some of the 40 markets are states, and some are metropolitan areas. I’ll update these tables throughout the month as additional data is released.
...
Here is a summary of active listings for these early reporting housing markets in September.
Inventory for these markets were down 4.7% YoY in August and are now down 2.2% YoY. It is likely inventory will be up YoY in a few months, but still at a historically low level (compared to pre-pandemic levels of inventory).
...
More local markets to come!

Hotels: Occupancy Rate decreased 0.2% Year-over-year
by Calculated Risk on 10/13/2023 09:49:00 AM
U.S. hotel performance increased from the previous week, and year-over-year comparisons were mostly positive, according to CoStar’s latest data through 7 October. ...The following graph shows the seasonal pattern for the hotel occupancy rate using the four-week average.
1-7 October 2023 (percentage change from comparable week in 2022):
• Occupancy: 67.8% (-0.2%)
• Average daily rate (ADR): US$163.19 (+5.4%)
• Revenue per available room (RevPAR): US$110.68 (+5.2%)
emphasis added
 Click on graph for larger image.
The red line is for 2023, black is 2020, blue is the median, and dashed light blue is for 2022. Dashed purple is for 2018, the record year for hotel occupancy.
The 4-week average of the occupancy rate is tracking close to last year, and just above the median rate for the period 2000 through 2022 (Blue).
Note: Y-axis doesn't start at zero to better show the seasonal change.
The 4-week average of the occupancy rate might pick up a little more during the Fall business travel season before declining in the Winter months.
Realtor.com Reports Weekly Active Inventory Down 2.4% YoY; New Listings Down 3.2% YoY
by Calculated Risk on 10/13/2023 08:11:00 AM
Realtor.com has monthly and weekly data on the existing home market. Here is their weekly report from Sabrina Speianu: Weekly Housing Trends View — Data Week Ending Oct 7, 2023
• Active inventory declined, with for-sale homes lagging behind year ago levels by 2.4%.
During the past week, we observed the 16th successive drop in the number of homes available for sale when compared to the previous year. This decline showed a slight improvement compared to the previous week’s -2.6% figure and inventory has been growing week-to-week over September and into October. However, despite this marginal improvement, inventory remained tight and came in 45.1% below typical pre-pandemic levels in September.
• New listings–a measure of sellers putting homes up for sale–were down again this week, by 3.2% from one year ago. .
For more than a year we have seen a consistent decline in the number of newly listed homes compared to the same period in the previous year. This past week, the gap compared to last year remains low as new listings were only 3.2% lower. However, last year’s pace of new listings was already historically low due to a steady rise in mortgage rates at that time. While this autumn’s listing pace is expected to catch up to last year, it is still notably much lower than pre-pandemic levels as we expect homeowners to continue to feel “locked-in” by mortgage rates ...
 Here is a graph of the year-over-year change in inventory according to realtor.com.
 Inventory was down 3.2% year-over-year - this was the sixteenth consecutive week with a YoY decrease following 58 consecutive weeks with a YoY increase in inventory.
The YoY decline in inventory has been getting smaller recently but will likely stay down YoY for the remainder of 2023 since inventory was increasing late into the year last year.
New listings really collapsed a year ago, so the YoY comparison for new listings is easier now - and new listings are still historically very low.
Thursday, October 12, 2023
YoY Measures of Inflation: Services, Goods and Shelter
by Calculated Risk on 10/12/2023 02:50:00 PM
Here are a few measures of inflation:
The first graph is the one Fed Chair Powell had mentioned earlier when services less rent of shelter was up 7.6% year-over-year. This has fallen sharply and is now up 2.8% YoY.
 Click on graph for larger image.
This graph shows the YoY price change for Services and Services less rent of shelter through September 2023.
Services were up 5.2% YoY as of September 2023, down from 5.4% YoY in August.
Services less rent of shelter was up 2.8% YoY in August, down from 3.1% YoY in August.
Services less rent of shelter was up 2.8% YoY in August, down from 3.1% YoY in August.
Earlier this year, a key question was: Would services ex-shelter inflation be persistent, or would it follow a similar pattern as goods? This is a topic I discussed in Pandemic Economics, Housing and Monetary Policy: Part 2.
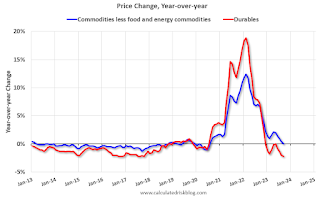 The second graph shows that goods prices started to increase year-over-year (YoY) in 2020 and accelerated in 2021 due to both strong demand and supply chain disruptions.
The second graph shows that goods prices started to increase year-over-year (YoY) in 2020 and accelerated in 2021 due to both strong demand and supply chain disruptions.Durables were at -2.2% YoY as of September 2023, down from -2.0% YoY in August.
Commodities less food and energy commodities were unchanged YoY in September, down from 0.4% YoY in August.
Commodities less food and energy commodities were unchanged YoY in September, down from 0.4% YoY in August.
Goods inflation was transitory.
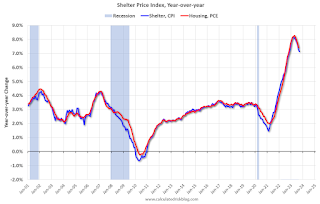 Here is a graph of the year-over-year change in shelter from the CPI report (through August) and housing from the PCE report (through July 2023)
Shelter was up 7.1% year-over-year in September, down from 7.2% in August. Housing (PCE) was up 7.4% YoY in August, down from 7.7% in July.
The BLS noted this morning: "The index for shelter was the largest contributor to the monthly all items increase, accounting for over half of the increase."
Core CPI ex-shelter was up 1.9% YoY in September, down from 2.3% in August.
Cleveland Fed: Median CPI increased 0.5% and Trimmed-mean CPI increased 0.4% in September
by Calculated Risk on 10/12/2023 11:22:00 AM
The Cleveland Fed released the median CPI and the trimmed-mean CPI.
According to the Federal Reserve Bank of Cleveland, the median Consumer Price Index rose 0.5% in September. The 16% trimmed-mean Consumer Price Index increased 0.4% in September. "The median CPI and 16% trimmed-mean CPI are measures of core inflation calculated by the Federal Reserve Bank of Cleveland based on data released in the Bureau of Labor Statistics’ (BLS) monthly CPI report".
 Click on graph for larger image.
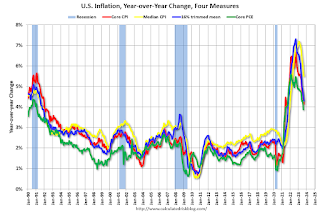
This graph shows the year-over-year change for these four key measures of inflation.
Note: The Cleveland Fed released the median CPI details. "Fuel oil and other fuels" increased at a 76% annualized rate in September, and "Lodging away from home" increased at a 54% annualized rate.
According to the Federal Reserve Bank of Cleveland, the median Consumer Price Index rose 0.5% in September. The 16% trimmed-mean Consumer Price Index increased 0.4% in September. "The median CPI and 16% trimmed-mean CPI are measures of core inflation calculated by the Federal Reserve Bank of Cleveland based on data released in the Bureau of Labor Statistics’ (BLS) monthly CPI report".
 Click on graph for larger image.
This graph shows the year-over-year change for these four key measures of inflation.
On a year-over-year basis, the median CPI rose 5.5% (down from 5.7% in August), the trimmed-mean CPI rose 4.3% (down from 4.5%), and the CPI less food and energy rose 4.1% (down from 4.3%).
Core PCE is for August was up 3.9% YoY, down from 4.2% in July.
Note: The Cleveland Fed released the median CPI details. "Fuel oil and other fuels" increased at a 76% annualized rate in September, and "Lodging away from home" increased at a 54% annualized rate.


