 RSS Feed
 by Calculated Risk on 10/20/2023 10:21:00 AM
Friday, October 20, 2023
Hotels: Occupancy Rate Decreased 2.3% Year-over-year
U.S. hotel performance increased from the previous week, and year-over-year comparisons remained mixed, according to CoStar’s latest data through 14 October.The following graph shows the seasonal pattern for the hotel occupancy rate using the four-week average.
8-14 October 2023 (percentage change from comparable week in 2022):
• Occupancy: 68.5% (-2.3%)
• Average daily rate (ADR): US$164.25 (+3.2%)
• Revenue per available room (RevPAR): US$112.51 (+0.8%)
emphasis added
 Click on graph for larger image.
The red line is for 2023, black is 2020, blue is the median, and dashed light blue is for 2022. Dashed purple is for 2018, the record year for hotel occupancy.
The 4-week average of the occupancy rate is tracking close to last year, and just above the median rate for the period 2000 through 2022 (Blue).
Note: Y-axis doesn't start at zero to better show the seasonal change.
The 4-week average of the occupancy rate will start to decline seasonally.
Realtor.com Reports Weekly Active Inventory Down 2.7% YoY; New Listings Down 4.4% YoY
by Calculated Risk on 10/20/2023 08:32:00 AM
Realtor.com has monthly and weekly data on the existing home market. Here is their weekly report from Danielle Hale: Weekly Housing Trends View — Data Week Ending Oct 14, 2023
• Active inventory declined, with for-sale homes lagging behind year ago levels by 2.7%. For 17 straight weeks, the number of homes available for sale has registered below that of the previous year.
• New listings–a measure of sellers putting homes up for sale–were down again this week, by 4.4% from one year ago. Since mid-2022, new listings have registered lower than prior year levels, as the mortgage-rate lock-in effect freezes homeowners with low-rate existing mortgages in place. Although the year over year declines are smaller now than the double-digit pace seen earlier in 2023, declines from the pre-pandemic period are still substantial.
 Here is a graph of the year-over-year change in inventory according to realtor.com.
 Inventory was down 2.7% year-over-year - this was the seventeenth consecutive week with a YoY decrease following 58 consecutive weeks with a YoY increase in inventory.
The YoY decline in inventory has generally been getting smaller recently but might stay down YoY for the remainder of 2023 since inventory was increasing late into the year last year. However, I expect inventory to be up YoY soon - but still historically very low.
New listings really collapsed a year ago, so the YoY comparison for new listings is easier now - and new listings remain historically very low.
Thursday, October 19, 2023
Fed Chair Powell: "Inflation is still too high", expects "a period of below-trend growth"
by Calculated Risk on 10/19/2023 12:00:00 PM
Speech by Chair Powell on the economic outlook. Excerpts:
Inflation readings turned lower over the summer, a very favorable development. The September inflation data continued the downward trend but were somewhat less encouraging. Shorter-term measures of core inflation over the most recent three and six months are now running below 3 percent. But these shorter-term measures are often volatile. In any case, inflation is still too high, and a few months of good data are only the beginning of what it will take to build confidence that inflation is moving down sustainably toward our goal. We cannot yet know how long these lower readings will persist, or where inflation will settle over coming quarters. While the path is likely to be bumpy and take some time, my colleagues and I are united in our commitment to bringing inflation down sustainably to 2 percent.
...
To date, declining inflation has not come at the cost of meaningfully higher unemployment—a highly welcome development, but a historically unusual one. Healing of supply chains in conjunction with the rebalancing of demand and supply in the labor market has allowed disinflation without substantially weaker economic activity. Indeed, economic growth has consistently surprised to the upside this year, as most recently seen in the strong retail sales data released earlier this week. Forecasters generally expect gross domestic product to come in very strong for the third quarter before cooling off in the fourth quarter and next year. Still, the record suggests that a sustainable return to our 2 percent inflation goal is likely to require a period of below-trend growth and some further softening in labor market conditions.
emphasis added
NAR: Existing-Home Sales Decreased to 3.96 million SAAR in September; New Cycle Low, First Sign of House Price Weakness
by Calculated Risk on 10/19/2023 10:40:00 AM
Today, in the CalculatedRisk Real Estate Newsletter: NAR: Existing-Home Sales Decreased to 3.96 million SAAR in September; New Cycle Low
Excerpt:
Sales Year-over-Year and Not Seasonally Adjusted (NSA)There is much more in the article. You can subscribe at https://calculatedrisk.substack.com/ Please subscribe!
The fourth graph shows existing home sales by month for 2022 and 2023.
Sales declined 15.4% year-over-year compared to September 2022. This was the twenty-fifth consecutive month with sales down year-over-year. This was a new cycle low, below the 4.00 million SAAR in January 2023.

NAR: Existing-Home Sales Decreased to 3.96 million SAAR in September
by Calculated Risk on 10/19/2023 10:00:00 AM
From the NAR: Existing-Home Sales Fell 2.0% in September
Existing-home sales faded in September, according to the National Association of REALTORS®. Among the four major U.S. regions, sales rose in the Northeast but receded in the Midwest, South and West. All four regions registered year-over-year sales declines.
Total existing-home sales – completed transactions that include single-family homes, townhomes, condominiums and co-ops – waned 2.0% from August to a seasonally adjusted annual rate of 3.96 million in September. Year-over-year, sales dropped 15.4% (down from 4.68 million in September 2022).
...
Total housing inventory registered at the end of September was 1.13 million units, up 2.7% from August but down 8.1% from one year ago (1.23 million). Unsold inventory sits at a 3.4-month supply at the current sales pace, up from 3.3 months in August and 3.2 months in September 2022.
emphasis added
 Click on graph for larger image.
This graph shows existing home sales, on a Seasonally Adjusted Annual Rate (SAAR) basis since 1994.
Sales in September (3.96 million SAAR) were down 2.0% from the previous month and were 15.4% below the September 2022 sales rate.
The second graph shows nationwide inventory for existing homes.
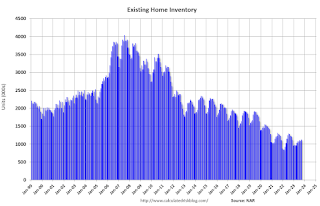 According to the NAR, inventory increased to 1.13 million in September down from 1.10 million the previous month.
 According to the NAR, inventory increased to 1.13 million in September down from 1.10 million the previous month.
Headline inventory is not seasonally adjusted, and inventory usually decreases to the seasonal lows in December and January, and peaks in mid-to-late summer.
The last graph shows the year-over-year (YoY) change in reported existing home inventory and months-of-supply. Since inventory is not seasonally adjusted, it really helps to look at the YoY change. Note: Months-of-supply is based on the seasonally adjusted sales and not seasonally adjusted inventory.
 Inventory was down 8.1% year-over-year (blue) in September compared to September 2022.
Months of supply (red) increased to 3.4 months in September from 3.3 months the previous month.
This was slightly above the consensus forecast. I'll have more later.
The last graph shows the year-over-year (YoY) change in reported existing home inventory and months-of-supply. Since inventory is not seasonally adjusted, it really helps to look at the YoY change. Note: Months-of-supply is based on the seasonally adjusted sales and not seasonally adjusted inventory.
 Inventory was down 8.1% year-over-year (blue) in September compared to September 2022.
 Months of supply (red) increased to 3.4 months in September from 3.3 months the previous month.
This was slightly above the consensus forecast. I'll have more later.
Weekly Initial Unemployment Claims Decrease to 198,000
by Calculated Risk on 10/19/2023 08:30:00 AM
The DOL reported:
In the week ending October 14, the advance figure for seasonally adjusted initial claims was 198,000, a decrease of 13,000 from the previous week's revised level. The previous week's level was revised up by 2,000 from 209,000 to 211,000. The 4-week moving average was 205,750, a decrease of 1,000 from the previous week's revised average. The previous week's average was revised up by 500 from 206,250 to 206,750.The following graph shows the 4-week moving average of weekly claims since 1971.
emphasis added
 Click on graph for larger image.
The dashed line on the graph is the current 4-week average. The four-week average of weekly unemployment claims decreased to 205,750.
The previous week was revised up.
Weekly claims were lower than the consensus forecast.
Wednesday, October 18, 2023
Thursday: Unemployment Claims, Philly Fed Mfg, Existing Home Sales, Fed Chair Powell
by Calculated Risk on 10/18/2023 08:33:00 PM
 Note: Mortgage rates are from MortgageNewsDaily.com and are for top tier scenarios.
Thursday:
• At 8:30 AM ET, The initial weekly unemployment claims report will be released. The consensus is for 210 thousand initial claims, up from 209 thousand last week.
• Aslo at 8:30 AM, the Philly Fed manufacturing survey for October. The consensus is for a reading of -6.8, up from -13.5.
• At 10:00 AM, Existing Home Sales for September from the National Association of Realtors (NAR). The consensus is for 3.94 million SAAR, down from 4.04 million in August.
• At 12:00 PM, Discussion, Fed Chair Jerome Powell, Economic Outlook, At the Economic Club of New York (ECNY) Luncheon, New York, New York
30-Year Mortgage Rates Hit 8.0%; California Home Sales Down 21.5% YoY in September
by Calculated Risk on 10/18/2023 02:26:00 PM
Today, in the CalculatedRisk Real Estate Newsletter: 30-Year Mortgage Rates Hit 8.0%
Excerpt:
Mortgage News Daily reports 30-year fixed rate mortgages rose to 8.0% today (for top tier scenarios).There is much more in the post. You can subscribe at https://calculatedrisk.substack.com/
This will mostly impact closed sales in November and December, and strongly suggests we will see new cycle lows for existing home sales over the winter.
Note: The National Association of Realtors (NAR) is scheduled to release September existing home sales tomorrow, Thursday, October 19th, at 10:00 AM ET. The consensus is the NAR will report sales of 3.94 million SAAR, down from 4.04 million in August.
Housing economist Tom Lawler expects the NAR to report sales of 4.00 million SAAR for September.
Due to the impact of Hurricane Ian in September 2022, existing home sales are up year-over-year in Florida, and that might have kept seasonally adjusted sales from hitting a new cycle low in September (it will be close).

Fed's Beige Book: "Little to no change in economic activity"
by Calculated Risk on 10/18/2023 02:00:00 PM
Fed's Beige Book "This report was prepared at the Federal Reserve Bank of St. Louis based on information collected on or before October 6, 2023. "
Most Districts indicated little to no change in economic activity since the September report. Consumer spending was mixed, especially among general retailers and auto dealers, due to differences in prices and product offerings. Tourism activity continued to improve, although some Districts reported slight slowing in consumer travel, and a few Districts noted an uptick in business travel. Banking contacts reported slight to modest declines in loan demand. Consumer credit quality was generally described as stable or healthy, with delinquency rates still historically low but slightly increasing. Real estate conditions were little changed and the inventory of homes for sale remained low. Manufacturing activity was mixed, although contacts across multiple Districts noted an improving outlook for the sector. The near-term outlook for the economy was generally described as stable or having slightly weaker growth. Expectations of firms for which the holiday shopping season is an important driver of sales were mixed.The beige book reports have shown far less economic growth in Q3 than the key economic indicators.
Labor market tightness continued to ease across the nation. Most Districts reported slight to moderate increases in overall employment, and firms were hiring less urgently.
emphasis added
AIA: Architecture Billings "New Decline in Business Condition"; Multi-family Billings Decline for 14th Consecutive Month
by Calculated Risk on 10/18/2023 12:00:00 PM
Note: This index is a leading indicator primarily for new Commercial Real Estate (CRE) investment.
From the AIA: AIA/Deltek Architecture Billings Index Reports New Decline in Business Condition
Business conditions at architecture firms declined again in September, the AIA/Deltek Architecture Billings Index (ABI) reports. The score of 44.8 for September is the lowest score reported since December 2020 during the height of the pandemic. Any score below 50.0 indicates decreasing business conditions and this score indicates a significant increase in firms reporting declining billings.
“The September ABI score reflects a marked downturn in business conditions at architecture firms, with the sharpest decline observed since the peak of the pandemic," said Kermit Baker, PhD, AIA Chief Economist. "While more firms are reporting a decrease in billings, the report also shows the hesitance among clients to commit to new projects with a slump in newly signed design contracts. As a result, backlogs at architecture firms fell to 6.5 months on average in the third quarter, their lowest level since the fourth quarter of 2021."
It's clear that all regions of the country are feeling this impact, with firms in the West continuing to face particularly challenging conditions Only one sector, firms with an institutional specialization, remained flat while all other sectors reported declining billings. Firms with a multifamily residential specialization saw more decline, a continuation of month over month declines since August 2022.
...
• Regional averages: Northeast (46.4); South (46.2); Midwest (49.3); West (44.3)
• ector index breakdown: commercial/industrial (45.0); institutional (50.1); mixed practice (firms that do not have at least half of their billings in any one other category) (46.2); multifamily residential (43.5)
emphasis added
 Click on graph for larger image.
This graph shows the Architecture Billings Index since 1996. The index was at 44.8 in September, down from 48.1 in August. Anything below 50 indicates a decrease in demand for architects' services.
Note: This includes commercial and industrial facilities like hotels and office buildings, multi-family residential, as well as schools, hospitals and other institutions.
This index usually leads CRE investment by 9 to 12 months, so this index suggests a slowdown in CRE investment into 2024.
Note that multi-family billing turned down in August 2022 and has been negative for fourteen consecutive months (with revisions). This suggests we will see a further weakness in multi-family starts.


