by Calculated Risk on 10/23/2023 04:01:00 PM
Monday, October 23, 2023
LA Port Traffic Increases in September
Notes: The expansion to the Panama Canal was completed in 2016 (As I noted several years ago), and some of the traffic that used the ports of Los Angeles and Long Beach is probably going through the canal. This might be impacting TEUs on the West Coast.
Container traffic gives us an idea about the volume of goods being exported and imported - and usually some hints about the trade report since LA area ports handle about 40% of the nation's container port traffic.
The following graphs are for inbound and outbound traffic at the ports of Los Angeles and Long Beach in TEUs (TEUs: 20-foot equivalent units or 20-foot-long cargo container).
To remove the strong seasonal component for inbound traffic, the first graph shows the rolling 12-month average.

On a rolling 12-month basis, inbound traffic increased 1.5% in September compared to the rolling 12 months ending in July. Outbound traffic increased 1.2% compared to the rolling 12 months ending the previous month.
 Usually imports peak in the July to October period as retailers import goods for the Christmas holiday, and then decline sharply and bottom in February or March depending on the timing of the Chinese New Year.
 Final Look at Local Housing Markets in September
by Calculated Risk on 10/23/2023 11:56:00 AM
Today, in the Calculated Risk Real Estate Newsletter: Final Look at Local Housing Markets in September
A brief excerpt:
Each month I track closed sales, new listings and active inventory in a sample of local markets around the country (over 40 local housing markets) in the US to get an early sense of changes in the housing market. In addition, we can look for regional differences.There is much more in the article. You can subscribe at https://calculatedrisk.substack.com/
After the National Association of Realtors® (NAR) releases the monthly existing home sales report, I pick up additional local market data that is reported after the NAR (and I’m adding more markets). This is the final look at local markets in September.
The big story for September was that existing home sales hit a new cycle low. Also new listings were down YoY, but less than over the Summer.
This table shows the YoY change in new listings since the start of 2023. The smaller decline is due to a combination of new listings collapsing in the 2nd half of 2022, and new listings holding up more than normal seasonally (but still historically very low).
...
More local data coming in November for activity in October!
Black Knight: Mortgage Delinquency Rate Increased in September
by Calculated Risk on 10/23/2023 09:42:00 AM
From ICE / Black Knight: ICE First Look at Monthly Mortgage Performance: Delinquencies Rose in September While Foreclosure Activity Remained Muted
• The national delinquency rate rose to 3.29% in September, up 12 basis points (BPS) from August and +13BPS year over year, marking only the second – and largest – annual increase in the past 2.5 yearsAccording to Black Knight's First Look report, the percent of loans delinquent increased 3.7% in September compared to August and increased 4.3% year-over-year.
• Despite the rise, the delinquency rate is still 71BPS below the level of pre-pandemic September 2019
• Loans 30 days past due rose by 48.8K (+5.1%) – marking the fourth consecutive monthly rise – while the 60-day delinquent population extended its own streak of increases (+8.7K; +3.0%) to six months
• At the national level, serious delinquencies (90+ days past due) rose by 7K to 455K, but remain 6.7% below September 2019 levels
• While overall delinquencies have risen, the number of loans in active foreclosure fell to 214K in September, its lowest point since March 2022 and some 25% below 2019 pre-pandemic levels
• Foreclosure starts also declined, falling by -20.4% in the month to 25.4K, with completed sales down 8% from the month prior
• Prepay activity (measured as single-month mortality) dropped to 0.45% under continued pressure from seasonal homebuying patterns confounded by interest rates north of 7%, and is down -26% year over year
emphasis added
Black Knight reported the U.S. mortgage delinquency rate (loans 30 or more days past due, but not in foreclosure) was 3.29% in August, up from 3.17% the previous month.
The percent of loans in the foreclosure process decreased in September to 0.40%, from 0.41% the previous month.
| Black Knight: Percent Loans Delinquent and in Foreclosure Process | ||||
|---|---|---|---|---|
| September 2023 | August 2023 | |||
| Delinquent | 3.29% | 3.17% | ||
| In Foreclosure | 0.40% | 0.41% | ||
| Number of properties: | ||||
| Number of properties that are delinquent, but not in foreclosure: | 1,749,000 | 1,684,000 | ||
| Number of properties in foreclosure pre-sale inventory: | 214,000 | 215,000 | ||
| Total Properties | 1,963,000 | 1,899,000 | ||
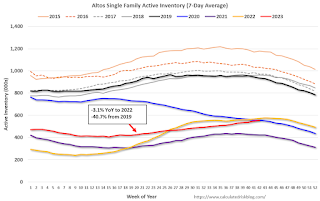
Housing October 23rd Weekly Update: Inventory increased 1.4% Week-over-week; Down 3.1% Year-over-year
by Calculated Risk on 10/23/2023 08:21:00 AM
 Click on graph for larger image.
This inventory graph is courtesy of Altos Research.

Sunday, October 22, 2023
Sunday Night Futures
by Calculated Risk on 10/22/2023 06:14:00 PM
Weekend:
• Schedule for Week of October 22, 2023
Monday:
• At 8:30 AM ET, Chicago Fed National Activity Index for September. This is a composite index of other data.
From CNBC: Pre-Market Data and Bloomberg futures S&P 500 futures are mostly unchanged (fair value).
Oil prices were up over the last week with WTI futures at $88.08 per barrel and Brent at $92.16 per barrel. A year ago, WTI was at $85, and Brent was at $92 - so WTI oil prices were up slightly year-over-year.
Here is a graph from Gasbuddy.com for nationwide gasoline prices. Nationally prices are at $3.51 per gallon. A year ago, prices were at $3.78 per gallon, so gasoline prices are down $0.27 year-over-year.
Retail: October Seasonal Hiring vs. Holiday Retail Sales
by Calculated Risk on 10/22/2023 08:21:00 AM
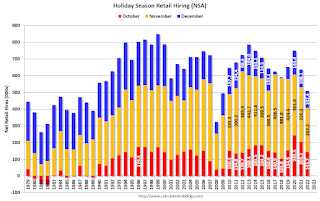
Every year I track seasonal retail hiring for hints about holiday retail sales. At the bottom of this post is a graph showing the correlation between October seasonal hiring and holiday retail sales.
Here is a graph of retail hiring for previous years based on the BLS employment report:

This graph shows the historical net retail jobs added for October, November and December by year.
Retailers hired 509 thousand seasonal workers last year (using BLS data, Not Seasonally Adjusted), and 144 thousand seasonal workers last October.
Note that in the early '90s, retailers started hiring seasonal workers earlier - and the trend towards hiring earlier has continued.
The following scatter graph is for the years 2005 through 2022 and compares October retail hiring with the real increase (inflation adjusted) for retail sales (Q4 over previous Q4).

NOTE: The dot in the upper right - with real Retail sales up over 10% YoY is for 2020 - when retail sales soared due to the pandemic spending on goods (service spending was soft).
Saturday, October 21, 2023
Real Estate Newsletter Articles this Week: Existing-Home Sales Decreased to New Cycle Low
by Calculated Risk on 10/21/2023 02:11:00 PM
At the Calculated Risk Real Estate Newsletter this week:
• September Housing Starts: Near Record Number of Multi-Family Housing Units Under Construction
• NAR: Existing-Home Sales Decreased to 3.96 million SAAR in September; New Cycle Low
• NMHC: "Apartment Market Continues to Loosen"
• Preliminary 2024 Housing Forecasts
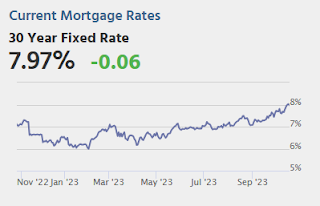
• 30-Year Mortgage Rates Hit 8.0%
• Lawler: Early Read on Existing Home Sales in September
This is usually published 4 to 6 times a week and provides more in-depth analysis of the housing market.
You can subscribe at https://calculatedrisk.substack.com/
Schedule for Week of October 22, 2023
by Calculated Risk on 10/21/2023 08:11:00 AM
The key reports this week are the advance estimate of Q3 GDP and September New Home sales.
Another key indicator is Personal Income and Outlays and PCE prices for September.
For manufacturing, the Richmond and Kansas City Fed manufacturing surveys will be released this week.
8:30 AM ET: Chicago Fed National Activity Index for September. This is a composite index of other data.
10:00 AM: Richmond Fed Survey of Manufacturing Activity for October.
7:00 AM ET: The Mortgage Bankers Association (MBA) will release the results for the mortgage purchase applications index.
 10:00 AM: New Home Sales for September from the Census Bureau.
 This graph shows New Home Sales since 1963. The dashed line is the sales rate for last month.
The consensus is for 679 thousand SAAR, up from 675 thousand in August.
4:35 PM: Speech, Fed Chair Jerome Powell, Introductory Remarks, At the 2023 Moynihan Lecture in Social Science and Public Policy, Washington, D.C.
8:30 AM: The initial weekly unemployment claims report will be released. The consensus is for 205 thousand initial claims, up from 198 thousand last week.
8:30 AM: Gross Domestic Product, 3rd quarter 2022 (advance estimate). The consensus is that real GDP increased 4.1% annualized in Q3, up from 2.1% in Q2.
8:30 AM ET: Durable Goods Orders for September from the Census Bureau. The consensus is for a 0.6% increase in durable goods orders.
11:00 AM: Kansas City Fed Survey of Manufacturing Activity for October.
10:00 AM: Pending Home Sales Index for September. The consensus is 1.0% increase in the index.
8:30 AM ET: Personal Income and Outlays for September. The consensus is for a 0.4% increase in personal income, and for a 0.3% increase in personal spending. And for the Core PCE price index to increase 0.3%. PCE prices are expected to be up 3.4% YoY, and core PCE prices up 3.7% YoY.
10:00 AM: University of Michigan's Consumer sentiment index (Final for October). The consensus is for a reading of 63.2.
Friday, October 20, 2023
Oct 20th COVID Update: Deaths and Hospitalizations Decreased
by Calculated Risk on 10/20/2023 08:08:00 PM

| COVID Metrics | ||||
|---|---|---|---|---|
| Now | Week Ago | Goal | ||
| Hospitalized2 | 13,533 | 14,724 | ≤3,0001 | |
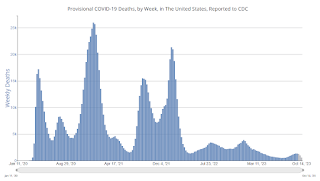
| Deaths per Week2 | 1,254 | 1,311 | ≤3501 | |
| 1my goals to stop weekly posts, 2Weekly for Currently Hospitalized, and Deaths 🚩 Increasing number weekly for Hospitalized and Deaths ✅ Goal met. | ||||
 Click on graph for larger image.
This graph shows the weekly (columns) number of deaths reported.
NMHC: "Apartment Market Continues to Loosen"
by Calculated Risk on 10/20/2023 02:46:00 PM
Today, in the Calculated Risk Real Estate Newsletter: NMHC: "Apartment Market Continues to Loosen"
A brief excerpt:
Apartment market conditions continued to weaken in the National Multifamily Housing Council's (NMHC) Quarterly Survey of Apartment Market Conditions for October 2023, as the Market Tightness (21), Sales Volume (24), Equity Financing (18), and Debt Financing (9) indexes all came in well below the breakeven level (50).There is more in the article. You can subscribe at https://calculatedrisk.substack.com/
...
• The Market Tightness Index came in at 21 this quarter—below the breakeven level (50)—indicating looser market conditions for the fifth consecutive quarter. Nearly two-thirds of respondents (64%) reported markets to be looser than three months ago, while only 6% thought markets have become tighter. Meanwhile, 27% of respondents thought that market conditions were unchanged over the past three months.


