by Calculated Risk on 10/25/2023 07:45:00 PM
Wednesday, October 25, 2023
Thursday: GDP, Unemployment Claims, Durable Goods, Pending Home Sales
Thursday:
• At 8:30 AM ET, The initial weekly unemployment claims report will be released. The consensus is for 205 thousand initial claims, up from 198 thousand last week.
• Also at 8:30 AM, Gross Domestic Product, 3rd quarter 2022 (advance estimate). The consensus is that real GDP increased 4.1% annualized in Q3, up from 2.1% in Q2.
• Also at 8:30 AM, Durable Goods Orders for September from the Census Bureau. The consensus is for a 0.6% increase in durable goods orders.
• At 11:00 AM, Kansas City Fed Survey of Manufacturing Activity for October.
• At 10:00 AM, Pending Home Sales Index for September. The consensus is 1.0% increase in the index.
October Vehicle Sales Forecast: 16.0 million SAAR, Up 9% YoY
by Calculated Risk on 10/25/2023 02:41:00 PM
From WardsAuto: October U.S. Light-Vehicle Sales Looking Good Despite Strike-Related Inventory Losses (pay content). Brief excerpt:
Sales are showing surprising strength in October despite the inventory hits taken at Ford, GM and Stellantis from strike-related plant shutdowns. Still, industry inventory at the end of the month will be lower by an estimated 5% because of the shutdowns, and November deliveries will be negatively impacted, too, as the rest of the industry will not be in a strong position to make up the to-date losses at the Detroit 3.
emphasis added
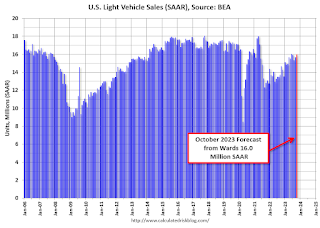 Click on graph for larger image.
This graph shows actual sales from the BEA (Blue), and Wards forecast for October (Red).
On a seasonally adjusted annual rate basis, the Wards forecast of 16.0 million SAAR, would be up 2% from last month, and up 9% from a year ago.
New Home Sales increase to 759,000 Annual Rate in September; Median New Home Price is Down 16% from the Peak
by Calculated Risk on 10/25/2023 10:46:00 AM
Today, in the Calculated Risk Real Estate Newsletter: New Home Sales increase to 759,000 Annual Rate in September
Brief excerpt:
The Census Bureau reports New Home Sales in September were at a seasonally adjusted annual rate (SAAR) of 759 thousand. The previous three months were revised down slightly, combined.You can subscribe at https://calculatedrisk.substack.com/.
...
The next graph shows new home sales for 2022 and 2023 by month (Seasonally Adjusted Annual Rate). Sales in September 2023 were up 33.9% from September 2022. Year-to-date sales are up 4.5% compared to the same period in 2022.
As expected, new home sales were up year-over-year in September, and it is fairly certain there will be more sales in 2023 than in 2022 - although mortgage rates close to 8% will likely slow sales.
New Home Sales increase to 759,000 Annual Rate in September
by Calculated Risk on 10/25/2023 10:00:00 AM
The Census Bureau reports New Home Sales in September were at a seasonally adjusted annual rate (SAAR) of 759 thousand.
The previous three months were revised down slightly, combined.
Sales of new single‐family houses in September 2023 were at a seasonally adjusted annual rate of 759,000, according to estimates released jointly today by the U.S. Census Bureau and the Department of Housing and Urban Development. This is 12.3 percent above the revised August rate of 676,000 and is 33.9 percent above the September 2022 estimate of 567,000.
emphasis added
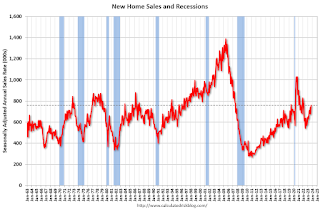 Click on graph for larger image.
The first graph shows New Home Sales vs. recessions since 1963. The dashed line is the current sales rate.
New home sales are above pre-pandemic levels.
The second graph shows New Home Months of Supply.
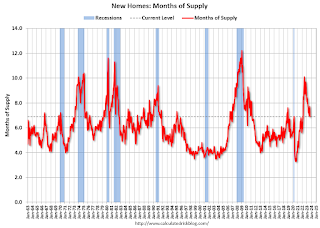 The months of supply decreased in September to 6.9 months from 7.7 months in August.
 The all-time record high was 12.2 months of supply in January 2009. The all-time record low was 3.3 months in August 2020.
This is above the top of the normal range (about 4 to 6 months of supply is normal).
"The seasonally‐adjusted estimate of new houses for sale at the end of September was 435,000. This represents a supply of 6.9 months at the current sales rate."Sales were well above expectations of 679 thousand SAAR, and sales for the three previous months were only revised down slightly, combined. I'll have more later today.
MBA: Mortgage Applications Decreased in Weekly Survey
by Calculated Risk on 10/25/2023 07:00:00 AM
From the MBA: Mortgage Applications Decrease in Latest MBA Weekly Survey
Mortgage applications decreased 1.0 percent from one week earlier, according to data from the Mortgage Bankers Association’s (MBA) Weekly Mortgage Applications Survey for the week ending October 20, 2023.
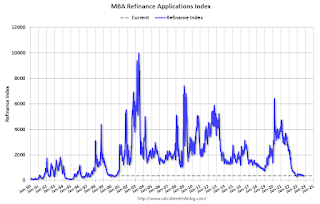
The Market Composite Index, a measure of mortgage loan application volume, decreased 1.0 percent on a seasonally adjusted basis from one week earlier. On an unadjusted basis, the Index decreased 1 percent compared with the previous week. The Refinance Index increased 2 percent from the previous week and was 8 percent lower than the same week one year ago. The seasonally adjusted Purchase Index decreased 2 percent from one week earlier. The unadjusted Purchase Index decreased 2 percent compared with the previous week and was 22 percent lower than the same week one year ago.
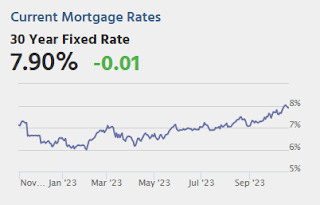
“Ten-year Treasury yields climbed higher last week, as global investors remained concerned about the prospect for higher-for-longer rates and burgeoning fiscal deficits. Mortgage rates followed Treasuries higher, with the 30-year fixed mortgage rate jumping 20 basis points to 7.9 percent – the highest since 2000. Rates have now risen seven consecutive weeks at a cumulative amount of 69 basis points,” said Joel Kan, MBA’s Vice President and Deputy Chief Economist. “Mortgage activity continued to stall, with applications dipping to the slowest weekly pace since 1995. These higher mortgage rates are keeping prospective homebuyers out of the market and continue to suppress refinance activity. The ARM share of applications inched up to 9.5 percent, its highest since November 2022.”
...
The average contract interest rate for 30-year fixed-rate mortgages with conforming loan balances ($726,200 or less) increased to 7.90 percent from 7.70 percent, with points increasing to 0.77 from 0.71 (including the origination fee) for 80 percent loan-to-value ratio (LTV) loans.
emphasis added
 Click on graph for larger image.
The first graph shows the MBA mortgage purchase index.
According to the MBA, purchase activity is down 22% year-over-year unadjusted.
Tuesday, October 24, 2023
Wednesday: New Home Sales
by Calculated Risk on 10/24/2023 07:36:00 PM
Wednesday:
• At 7:00 AM ET, The Mortgage Bankers Association (MBA) will release the results for the mortgage purchase applications index.
• At 10:00 AM, New Home Sales for September from the Census Bureau. The consensus is for 679 thousand SAAR, up from 675 thousand in August.
• At 4:35 PM, Speech, Fed Chair Jerome Powell, Introductory Remarks, At the 2023 Moynihan Lecture in Social Science and Public Policy, Washington, D.C.
Goldman: 2024 Housing Outlook
by Calculated Risk on 10/24/2023 12:23:00 PM
A few excerpts from a research note by Goldman Sachs economist Ronnie Walker: Higher for Longer and the 2024 Housing Outlook
Sustained higher mortgage rates will have their most pronounced impact in 2024 on housing turnover. ... As a result, we expect the fewest annual existing home sales since the early 1990s at 3.8mn.
While vacancy rates remain at historic lows, we expect housing starts to decline by 4% to 1.34mn in 2024, reflecting sharply fewer multifamily starts.
We expect only modest home price growth of +1.3% in 2024, as supply remains tight but high rates weigh on affordability.
Total Housing Completions Will Likely Increase Slightly in 2023; The Mix will Change
by Calculated Risk on 10/24/2023 08:23:00 AM
Today, in the Calculated Risk Real Estate Newsletter: Total Housing Completions Will Likely Increase Slightly in 2023; The Mix will Change
Brief excerpt:
Although housing starts have slowed, completions will likely increase slightly in 2023.You can subscribe at https://calculatedrisk.substack.com/.
This graph shows total housing completions and placements since 1968 with an estimate for 2023 based on completions through September. Note that the net additional to the housing stock is less because of demolitions and destruction of older housing units.
My current estimate is total completions (single family, multi-family, manufactured homes) will increase in 2023 to around 1.535 million, up from 1.503 million in 2022. However, the mix will change significantly from 2022 with fewer single-family completions and fewer manufactured homes, and more multi-family completions.
Monday, October 23, 2023
Tuesday: Richmond Fed Mfg
by Calculated Risk on 10/23/2023 08:16:00 PM
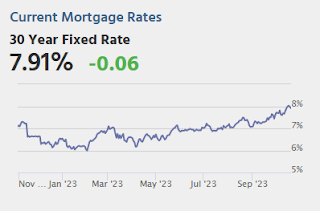
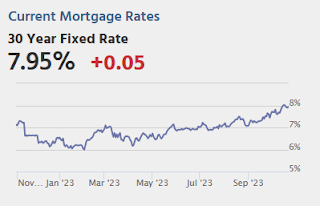
In terms of MND's index, we started at 8.01 this morning versus 7.97 on Friday afternoon. The intraday gains ultimately paved the way for a drop to 7.91.Tuesday:
As always, keep in mind that this is an index value that represents an a effective top tier rate for the most ideal 30yr fixed scenario. It means that plenty of loans are being done at rates in the 8%+ range and many continue to be quoted in the mid-to-high 7s. Loans in the 7% range tend to have discount points or buydowns. [30 year fixed 7.91%]
emphasis added
• At 10:00 AM ET, Richmond Fed Survey of Manufacturing Activity for October.
LA Port Traffic Increases in September
by Calculated Risk on 10/23/2023 04:01:00 PM
Notes: The expansion to the Panama Canal was completed in 2016 (As I noted several years ago), and some of the traffic that used the ports of Los Angeles and Long Beach is probably going through the canal. This might be impacting TEUs on the West Coast.
Container traffic gives us an idea about the volume of goods being exported and imported - and usually some hints about the trade report since LA area ports handle about 40% of the nation's container port traffic.
The following graphs are for inbound and outbound traffic at the ports of Los Angeles and Long Beach in TEUs (TEUs: 20-foot equivalent units or 20-foot-long cargo container).
To remove the strong seasonal component for inbound traffic, the first graph shows the rolling 12-month average.

On a rolling 12-month basis, inbound traffic increased 1.5% in September compared to the rolling 12 months ending in July. Outbound traffic increased 1.2% compared to the rolling 12 months ending the previous month.
 Usually imports peak in the July to October period as retailers import goods for the Christmas holiday, and then decline sharply and bottom in February or March depending on the timing of the Chinese New Year.

