 RSS Feed
 by Calculated Risk on 10/27/2023 11:34:00 AM
Friday, October 27, 2023
October CES Strike Report
Here is the CES Strike report for October released this morning:
 This shows a total of 48,100 workers on strike in October, 30,400 new (mostly UAW), and no strikers that returned to work for the October reference period (contains the 12th of the month).
This will reduce employment gains in October.
Fannie and Freddie: Single-Family Mortgage Delinquency Rate Mostly Unchanged in September
by Calculated Risk on 10/27/2023 10:17:00 AM
Today, in the Calculated Risk Real Estate Newsletter: Fannie and Freddie: Single-Family Mortgage Delinquency Rate Mostly Unchanged in September
Brief excerpt:
I’ve argued that there would not be a huge wave of single-family foreclosures this cycle since lending standards have been solid and most homeowners have substantial equity. That means we will not see cascading price declines like following the housing bubble. Delinquencies are a trailing indicator but are something to watch.You can subscribe at https://calculatedrisk.substack.com/.
However, there is some concern about some multi-family properties.
...
Freddie Mac reports that multi-family delinquencies decreased to 0.24% in September, down from 0.25% in August. This was up from 0.13% in September 2022.
This graph shows the Freddie multi-family serious delinquency rate since 2012. Delinquency rates were still high in 2012 following the housing bust and financial crisis.
The multi-family delinquency rate increased following the pandemic and has increased recently as rent growth has stalled, vacancy rates have increased, lending has tightened, and interest rates have increased sharply. This will be something to watch as rents soften.

PCE Measure of Shelter Slows to 7.2% YoY in September
by Calculated Risk on 10/27/2023 08:48:00 AM
Here is a graph of the year-over-year change in shelter from the CPI report and housing from the PCE report this morning, both through September 2023.
 CPI Shelter was up 7.1% year-over-year in September, down from 7.2% in August, and down from the cycle peak of 8.2% in March 2023.
Housing (PCE) was up 7.2% YoY in September, down from 7.4% in August, and down from the cycle peak of 8.3% in April 2023.
Since asking rents are slightly negative year-over-year, these measures will continue to slow over coming months.
Since asking rents are slightly negative year-over-year, these measures will continue to slow over coming months.
Personal Income increased 0.3% in September; Spending increased 0.7%
by Calculated Risk on 10/27/2023 08:36:00 AM
The BEA released the Personal Income and Outlays report for September:
Personal income increased $77.8 billion (0.3 percent at a monthly rate) in September, according to estimates released today by the Bureau of Economic Analysis. Disposable personal income (DPI), personal income less personal current taxes, increased $56.1 billion (0.3 percent) and personal consumption expenditures (PCE) increased $138.7 billion (0.7 percent).The September PCE price index increased 3.4 percent year-over-year (YoY), unchanged from 3.4 percent YoY in August, and down from the recent peak of 7.0 percent in June 2022.
The PCE price index increased 0.4 percent. Excluding food and energy, the PCE price index increased 0.3 percent. Real DPI decreased 0.1 percent in September and real PCE increased 0.4 percent; goods increased 0.5 percent and services increased 0.3 percent
emphasis added
The PCE price index, excluding food and energy, increased 3.7 percent YoY, down from 3.8 percent in August, and down from the recent peak of 5.4 percent in February 2022.
The following graph shows real Personal Consumption Expenditures (PCE) through September 2023 (2017 dollars). Note that the y-axis doesn't start at zero to better show the change.
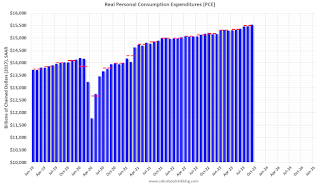 Click on graph for larger image.
The dashed red lines are the quarterly levels for real PCE.
Personal income was slightly below expectations, and PCE was well above expectations.
Inflation was at expectations.
Thursday, October 26, 2023
Friday: Personal Income and Outlays
by Calculated Risk on 10/26/2023 08:39:00 PM
 Note: Mortgage rates are from MortgageNewsDaily.com and are for top tier scenarios.
Thursday:
• At 8:30 AM ET, Personal Income and Outlays for September. The consensus is for a 0.4% increase in personal income, and for a 0.3% increase in personal spending. And for the Core PCE price index to increase 0.3%. PCE prices are expected to be up 3.4% YoY, and core PCE prices up 3.7% YoY.
• At 10:00 AM, University of Michigan's Consumer sentiment index (Final for October). The consensus is for a reading of 63.2.
Realtor.com Reports Weekly Active Inventory Down 2.0% YoY; New Listings Down 1.0% YoY
by Calculated Risk on 10/26/2023 05:33:00 PM
Realtor.com has monthly and weekly data on the existing home market. Here is their weekly report from Jiayi Xu: Weekly Housing Trends View — Data Week Ending Oct 21, 2023
• Active inventory declined, with for-sale homes lagging behind year ago levels by 2.0%. For 18 straight weeks, the number of homes available for sale has registered below that of the previous year. ... The number of for-sale homes registered 45.1% below typical pre-pandemic levels in September.
• New listings–a measure of sellers putting homes up for sale–were down again this week, by 1.0% from one year ago. Since mid-2022, new listings have registered lower than prior year levels, as the mortgage-rate lock-in effect freezes homeowners with low-rate existing mortgages in place. Although the year over year declines are smaller now than the double-digit pace seen earlier in 2023, declines from the pre-pandemic period are still substantial.
 Here is a graph of the year-over-year change in inventory according to realtor.com.
 Inventory was down 2.0% year-over-year - this was the eighteenth consecutive week with a YoY decrease following 58 consecutive weeks with a YoY increase in inventory.
The YoY decline in inventory has generally been getting smaller recently but might stay down YoY for the remainder of 2023 since inventory was increasing late into the year last year. However, I expect inventory to be up YoY soon - but still historically very low.
New listings really collapsed a year ago, so the YoY comparison for new listings is easier now - and although new listings remain historically very low, new listings will likely be up YoY soon.
CoreLogic: "US Serious Mortgage Delinquency Rate Drops to All-Time Low in August"
by Calculated Risk on 10/26/2023 02:19:00 PM
From CoreLogic: US Serious Mortgage Delinquency Rate Drops to All-Time Low in August
• The share of U.S. borrowers who were in serious mortgage delinquency (90 days or more late on payments) dropped to 0.9% in August, the lowest recorded since January 1999.
• The overall national mortgage delinquency rate (30 days or more late) was at 2.6% in August, also a historic low.
• The U.S. foreclosure rate held steady at 0.3% in August, unchanged since early 2022.
• Only Idaho and Utah saw slight annual upticks in overall mortgage delinquency growth in August, both up by 0.1 percentage point.
• Fifty-one metro areas posted year-over-year mortgage delinquency rate increases in August.

To gain a complete view of the mortgage market and loan performance health, CoreLogic examines all stages of delinquency. In August 2023, the U.S. delinquency and transition rates and their year-over-year changes, were as follows:• Early-Stage Delinquencies (30 to 59 days past due): 1.3%, up from 1.2% in August 2022.
• Adverse Delinquency (60 to 89 days past due): 0.4%, up from 0.3% in August 2022.
• Serious Delinquency (90 days or more past due, including loans in foreclosure): 0.9%, down from 1.2% in August 2022 and a high of 4.3% in August 2020.
• Foreclosure Inventory Rate (the share of mortgages in some stage of the foreclosure process): 0.3%, unchanged from August 2022.
• Transition Rate (the share of mortgages that transitioned from current to 30 days past due): 0.6%, unchanged from August 2022.
NAR: Pending Home Sales Increase 1.1% in September; Down 11% Year-over-year
by Calculated Risk on 10/26/2023 10:00:00 AM
From the NAR: Pending Home Sales Grew 1.1% in September
Pending home sales augmented 1.1% in September, according to the National Association of REALTORS®. The Northeast, Midwest and South posted monthly gains in transactions while the West experienced a loss. All four U.S. regions had year-over-year declines in transactions.This was above expectations. Note: Contract signings usually lead sales by about 45 to 60 days, so this would usually be for closed sales in October and November.
"Despite the slight gain, pending contracts remain at historically low levels due to the highest mortgage rates in 20 years," said Lawrence Yun, NAR chief economist. "Furthermore, inventory remains tight, which hinders sales but keeps home prices elevated."
The Pending Home Sales Index (PHSI)* – a forward-looking indicator of home sales based on contract signings – rose 1.1% to 72.6 in September. Year over year, pending transactions declined 11%. An index of 100 is equal to the level of contract activity in 2001.
...
The Northeast PHSI increased 0.8% from last month to 63.1, a loss of 12.7% from September 2022. The Midwest index expanded 4.1% to 74.3 in September, down 9.2% from one year ago.
The South PHSI rose 0.7% to 87.1 in September, retreating 10.7% from the prior year. The West index declined 1.8% in September to 55.3, dropping 12.9% from September 2022.
emphasis added
BEA: Real GDP increased at 4.9% Annualized Rate in Q3
by Calculated Risk on 10/26/2023 08:37:00 AM
From the BEA: Gross Domestic Product, Third Quarter 2023 (Advance Estimate)
Real gross domestic product (GDP) increased at an annual rate of 4.9 percent in the third quarter of 2023, according to the "advance" estimate released by the Bureau of Economic Analysis. In the second quarter, real GDP increased 2.1 percent.PCE increased at a 4.0% annual rate, and residential investment increased at a 3.9% rate. The advance Q3 GDP report, with 4.9% annualized increase, was above expectations.
The increase in real GDP reflected increases in consumer spending, private inventory investment, exports, state and local government spending, federal government spending, and residential fixed investment that were partly offset by a decrease in nonresidential fixed investment. Imports, which are a subtraction in the calculation of GDP, increased.
The increase in consumer spending reflected increases in both services and goods. Within services, the leading contributors were housing and utilities, health care, financial services and insurance, and food services and accommodations. Within goods, the leading contributors to the increase were other nondurable goods (led by prescription drugs) as well as recreational goods and vehicles. The increase in private inventory investment reflected increases in manufacturing and retail trade. Within nonresidential fixed investment, a decrease in equipment was partly offset by increases in intellectual property products and structures.
Compared to the second quarter, the acceleration in real GDP in the third quarter reflected accelerations in consumer spending, private inventory investment, and federal government spending and upturns in exports and residential fixed investment. These movements were partly offset by a downturn in nonresidential fixed investment and a deceleration in state and local government spending. Imports turned up.
emphasis added
I'll have more later ...
Weekly Initial Unemployment Claims Increase to 210,000
by Calculated Risk on 10/26/2023 08:30:00 AM
The DOL reported:
In the week ending October 21, the advance figure for seasonally adjusted initial claims was 210,000, an increase of 10,000 from the previous week's revised level. The previous week's level was revised up by 2,000 from 198,000 to 200,000. The 4-week moving average was 207,500, an increase of 1,250 from the previous week's revised average. The previous week's average was revised up by 500 from 205,750 to 206,250.The following graph shows the 4-week moving average of weekly claims since 1971.
emphasis added
 Click on graph for larger image.
The dashed line on the graph is the current 4-week average. The four-week average of weekly unemployment claims increased to 207,500.
The previous week was revised up.
Weekly claims were higher than the consensus forecast.


