 RSS Feed
 by Calculated Risk on 10/29/2023 12:17:00 PM
Sunday, October 29, 2023
Hotels: Occupancy Rate Decreased 0.8% Year-over-year
U.S. hotel performance increased from the previous week and showed improved year-over-year comparisons, according to CoStar’s latest data through 21 October.The following graph shows the seasonal pattern for the hotel occupancy rate using the four-week average.
15-21 October 2023 (percentage change from comparable week in 2022):
• Occupancy: 69.0% (-0.8%)
• Average daily rate (ADR): US$165.32 (+3.8%)
• Revenue per available room (RevPAR): US$114.04 (+2.9%)
emphasis added
 Click on graph for larger image.
The red line is for 2023, black is 2020, blue is the median, and dashed light blue is for 2022. Dashed purple is for 2018, the record year for hotel occupancy.
The 4-week average of the occupancy rate is tracking close to last year, and just above the median rate for the period 2000 through 2022 (Blue).
Note: Y-axis doesn't start at zero to better show the seasonal change.
The 4-week average of the occupancy rate will decline seasonally for the next couple of months.
FOMC Preview: No Change to Policy Expected
by Calculated Risk on 10/29/2023 08:21:00 AM
Most analysts expect there will be no change to FOMC policy at this meeting, keeping the target range for the federal funds rate at 5‑1/4 to 5-1/2 percent.
On the meeting this week from BofA:
"We still do not expect a hike in November, as the Fed is clearly worried about the extent of financial tightening. But today’s robust spending and inflation data keep a December hike on the table, as they are a reminder that the war on inflation has not yet been won."And from Goldman Sachs economists:
emphasis added
"Fed officials appear to have signaled that they will not be hiking at their November meeting next week, and we interpret their recent comments to imply that most would prefer not to hike again, consistent with our forecast. ... the story of the year so far has been that economic reacceleration has not prevented further labor market rebalancing and progress in the inflation fight. We expect this to continue in coming months, with core PCE on track to undershoot the FOMC’s year-end projections."
Projections will not be released at this meeting. For review, here are the September projections. Since the last projections were released, the economy has performed better than the FOMC expected, and inflation was slightly below expectations.
The BEA reported real GDP increased at a 4.9% annual rate in Q3. After three quarters, GDP has increased at a 3.1% annual rate in 2023, and to hit the high end of the FOMC projection for Q4, GDP would have to decrease 0.3% in Q4. To hit the low end of the FOMC projection, GDP would have to decrease 1.5% in Q4.
The FOMC projection for year-over-year growth in Q4 2023 appears too low.
| GDP projections of Federal Reserve Governors and Reserve Bank presidents, Change in Real GDP1 | ||||
|---|---|---|---|---|
| Projection Date | 2023 | 2024 | 2025 | |
| Sept 2023 | 1.9 to 2.2 | 1.2 to 1.8 | 1.6 to 2.0 | |
| June 2023 | 0.7 to 1.2 | 0.9 to 1.5 | 1.6 to 2.0 | |
The unemployment rate was at 3.8% in September. The FOMC's unemployment rate projection for Q4 is probably close.
| Unemployment projections of Federal Reserve Governors and Reserve Bank presidents, Unemployment Rate2 | ||||
|---|---|---|---|---|
| Projection Date | 2023 | 2024 | 2025 | |
| Sept 2023 | 3.7 to 3.9 | 3.9 to 4.4 | 3.9 to 4.3 | |
| June 2023 | 4.0 to 4.3 | 4.3 to 4.6 | 4.3 to 4.6 | |
As of September 2023, PCE inflation increased 3.4 percent year-over-year (YoY), unchanged from 3.4 percent YoY in August, and down from the recent peak of 7.1 percent in June 2022. It appears YoY PCE inflation will be close to the FOMC projection for Q4.
| Inflation projections of Federal Reserve Governors and Reserve Bank presidents, PCE Inflation1 | ||||
|---|---|---|---|---|
| Projection Date | 2023 | 2024 | 2025 | |
| Sept 2023 | 3.2 to 3.4 | 2.3 to 2.7 | 2.0 to 2.3 | |
| June 2023 | 3.0 to 3.5 | 2.3 to 2.8 | 2.0 to 2.4 | |
PCE core inflation increased 3.7 percent YoY, down from 3.8 percent in August, and down from the recent peak of 5.6 percent in February 2022. This remains a concern for the FOMC, however this includes shelter that was up 7.2% YoY in September (even though asking rents are mostly unchanged YoY). Also, core PCE inflation was fairly high in Q4 2022, and it seems likely YoY core PCE inflation will be at or below the low end of the FOMC Q4 projection.
| Core Inflation projections of Federal Reserve Governors and Reserve Bank presidents, Core Inflation1 | ||||
|---|---|---|---|---|
| Projection Date | 2023 | 2024 | 2025 | |
| Sept 2023 | 3.6 to 3.9 | 2.5 to 2.8 | 2.0 to 2.4 | |
| June 2023 | 3.7 to 4.2 | 2.5 to 3.1 | 2.0 to 2.4 | |
Saturday, October 28, 2023
Real Estate Newsletter Articles this Week: New Home Sales increase to 759,000 Annual Rate in September
by Calculated Risk on 10/28/2023 02:11:00 PM
At the Calculated Risk Real Estate Newsletter this week:
• New Home Sales increase to 759,000 Annual Rate in September
• Total Housing Completions Will Likely Increase Slightly in 2023; The Mix will Change
• Final Look at Local Housing Markets in September
• Fannie and Freddie: Single-Family Mortgage Delinquency Rate Mostly Unchanged in September
This is usually published 4 to 6 times a week and provides more in-depth analysis of the housing market.
You can subscribe at https://calculatedrisk.substack.com/
Schedule for Week of October 29, 2023
by Calculated Risk on 10/28/2023 08:11:00 AM
Boo!
The key report this week is the October employment report on Friday.
Other key indicators include the Case-Shiller house prices for August, October ISM manufacturing and services indexes, and October vehicle sales.
The FOMC meets this week and no change to policy is expected.
10:30 AM: Dallas Fed Survey of Manufacturing Activity for October. This is the last regional Fed survey for October.
 9:00 AM ET: S&P/Case-Shiller House Price Index for August. The consensus is for the Composite 20 index to be up 0.1% year-over-year.
This graph shows the year-over-year change in the nominal seasonally adjusted National Index, Composite 10 and Composite 20 indexes through the most recent report (the Composite 20 was started in January 2000).
9:00 AM: FHFA House Price Index for August. This was originally a GSE only repeat sales, however there is also an expanded index.
9:45 AM: Chicago Purchasing Managers Index for October. The consensus is for a reading of 44.8, up from 44.1 in September.
10:00 AM: The Q3 Housing Vacancies and Homeownership report from the Census Bureau.
7:00 AM ET: The Mortgage Bankers Association (MBA) will release the results for the mortgage purchase applications index.
8:15 AM: The ADP Employment Report for October. This report is for private payrolls only (no government). The consensus is for 135,000 jobs added, up from 89,000 in September.
 10:00 AM: Job Openings and Labor Turnover Survey for August from the BLS.
 This graph shows job openings (black line), hires (purple), Layoff, Discharges and other (red column), and Quits (light blue column) from the JOLTS.
Jobs openings increased in August to 9.61 million from 8.92 million in July.
The number of job openings (black) were down 6% year-over-year. Quits were down 14% year-over-year.
10:00 AM: ISM Manufacturing Index for October. The consensus is for 49.0, unchanged from 49.0.
10:00 AM: Construction Spending for September. The consensus is for 0.4% increase in spending.
2:00 PM: FOMC Meeting Announcement. No change to FOMC policy is expected at this meeting.
2:30 PM: Fed Chair Jerome Powell holds a press briefing following the FOMC announcement.
 All day: Light vehicle sales for October.
The consensus is for sales of 15.1 million SAAR, down from 15.7 million SAAR in September (Seasonally Adjusted Annual Rate).
This graph shows light vehicle sales since the BEA started keeping data in 1967. The dashed line is the current sales rate.
8:30 AM: The initial weekly unemployment claims report will be released. The consensus is for 214 thousand initial claims, up from 210 thousand last week.
 8:30 AM: Employment Report for October. The consensus is for 168,000 jobs added, and for the unemployment rate to be unchanged at 3.8%.
There were 336,000 jobs added in September, and the unemployment rate was at 3.8%.
This graph shows the jobs added per month since January 2021.
10:00 AM: the ISM Services Index for October. The consensus is for a decrease to 53.0 from 53.6.
Friday, October 27, 2023
Oct 27th COVID Update: Deaths and Hospitalizations Decreased
by Calculated Risk on 10/27/2023 07:53:00 PM
 Note: Mortgage rates are from MortgageNewsDaily.com and are for top tier scenarios.
Due to changes at the CDC, weekly cases are no longer updated.
For deaths, I'm currently using 3 weeks ago for "now", since the most recent two weeks will be revised significantly.
Recently hospitalizations have more than doubled from a low of 5,150 in June 2023, but have declined over the last few weeks.
Hospitalizations are far below the peak of 150,000 in January 2022.
| COVID Metrics | ||||
|---|---|---|---|---|
| Now | Week Ago | Goal | ||
| Hospitalized2 | 13,036 | 13,652 | ≤3,0001 | |
| Deaths per Week2 | 1,182 | 1,339 | ≤3501 | |
| 1my goals to stop weekly posts, 2Weekly for Currently Hospitalized, and Deaths 🚩 Increasing number weekly for Hospitalized and Deaths ✅ Goal met. | ||||
 Click on graph for larger image.
This graph shows the weekly (columns) number of deaths reported.
Weekly deaths have more than doubled from a low of 469 in early July. Weekly deaths are far below the weekly peak of 26,000 in January 2021.
October CES Strike Report
by Calculated Risk on 10/27/2023 11:34:00 AM
Here is the CES Strike report for October released this morning:
 This shows a total of 48,100 workers on strike in October, 30,400 new (mostly UAW), and no strikers that returned to work for the October reference period (contains the 12th of the month).
This will reduce employment gains in October.
Fannie and Freddie: Single-Family Mortgage Delinquency Rate Mostly Unchanged in September
by Calculated Risk on 10/27/2023 10:17:00 AM
Today, in the Calculated Risk Real Estate Newsletter: Fannie and Freddie: Single-Family Mortgage Delinquency Rate Mostly Unchanged in September
Brief excerpt:
I’ve argued that there would not be a huge wave of single-family foreclosures this cycle since lending standards have been solid and most homeowners have substantial equity. That means we will not see cascading price declines like following the housing bubble. Delinquencies are a trailing indicator but are something to watch.You can subscribe at https://calculatedrisk.substack.com/.
However, there is some concern about some multi-family properties.
...
Freddie Mac reports that multi-family delinquencies decreased to 0.24% in September, down from 0.25% in August. This was up from 0.13% in September 2022.
This graph shows the Freddie multi-family serious delinquency rate since 2012. Delinquency rates were still high in 2012 following the housing bust and financial crisis.
The multi-family delinquency rate increased following the pandemic and has increased recently as rent growth has stalled, vacancy rates have increased, lending has tightened, and interest rates have increased sharply. This will be something to watch as rents soften.

PCE Measure of Shelter Slows to 7.2% YoY in September
by Calculated Risk on 10/27/2023 08:48:00 AM
Here is a graph of the year-over-year change in shelter from the CPI report and housing from the PCE report this morning, both through September 2023.
 CPI Shelter was up 7.1% year-over-year in September, down from 7.2% in August, and down from the cycle peak of 8.2% in March 2023.
Housing (PCE) was up 7.2% YoY in September, down from 7.4% in August, and down from the cycle peak of 8.3% in April 2023.
Since asking rents are slightly negative year-over-year, these measures will continue to slow over coming months.
Since asking rents are slightly negative year-over-year, these measures will continue to slow over coming months.
Personal Income increased 0.3% in September; Spending increased 0.7%
by Calculated Risk on 10/27/2023 08:36:00 AM
The BEA released the Personal Income and Outlays report for September:
Personal income increased $77.8 billion (0.3 percent at a monthly rate) in September, according to estimates released today by the Bureau of Economic Analysis. Disposable personal income (DPI), personal income less personal current taxes, increased $56.1 billion (0.3 percent) and personal consumption expenditures (PCE) increased $138.7 billion (0.7 percent).The September PCE price index increased 3.4 percent year-over-year (YoY), unchanged from 3.4 percent YoY in August, and down from the recent peak of 7.0 percent in June 2022.
The PCE price index increased 0.4 percent. Excluding food and energy, the PCE price index increased 0.3 percent. Real DPI decreased 0.1 percent in September and real PCE increased 0.4 percent; goods increased 0.5 percent and services increased 0.3 percent
emphasis added
The PCE price index, excluding food and energy, increased 3.7 percent YoY, down from 3.8 percent in August, and down from the recent peak of 5.4 percent in February 2022.
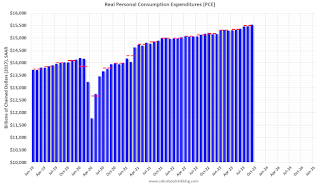
The following graph shows real Personal Consumption Expenditures (PCE) through September 2023 (2017 dollars). Note that the y-axis doesn't start at zero to better show the change.
 Click on graph for larger image.
The dashed red lines are the quarterly levels for real PCE.
Personal income was slightly below expectations, and PCE was well above expectations.
Inflation was at expectations.
Thursday, October 26, 2023
Friday: Personal Income and Outlays
by Calculated Risk on 10/26/2023 08:39:00 PM
 Note: Mortgage rates are from MortgageNewsDaily.com and are for top tier scenarios.
Thursday:
• At 8:30 AM ET, Personal Income and Outlays for September. The consensus is for a 0.4% increase in personal income, and for a 0.3% increase in personal spending. And for the Core PCE price index to increase 0.3%. PCE prices are expected to be up 3.4% YoY, and core PCE prices up 3.7% YoY.
• At 10:00 AM, University of Michigan's Consumer sentiment index (Final for October). The consensus is for a reading of 63.2.


