 RSS Feed
 by Calculated Risk on 10/31/2023 08:19:00 PM
Tuesday, October 31, 2023
Wednesday: FOMC Statement, Job Openings, Vehicle Sales, ISM Manufacturing and More
 Note: Mortgage rates are from MortgageNewsDaily.com and are for top tier scenarios.
Wednesday:
• At 7:00 AM ET, The Mortgage Bankers Association (MBA) will release the results for the mortgage purchase applications index.
• At 8:15 AM, The ADP Employment Report for October. This report is for private payrolls only (no government). The consensus is for 135,000 jobs added, up from 89,000 in September.
• At 10:00 AM, Job Openings and Labor Turnover Survey for August from the BLS.
• At 10:00 AM, ISM Manufacturing Index for October. The consensus is for 49.0, unchanged from 49.0.
• At 10:00 AM, Construction Spending for September. The consensus is for 0.4% increase in spending.
• At 2:00 PM, FOMC Meeting Announcement. No change to FOMC policy is expected at this meeting.
• At 2:30 PM, Fed Chair Jerome Powell holds a press briefing following the FOMC announcement.
• All day: Light vehicle sales for October. The consensus is for sales of 15.1 million SAAR, down from 15.7 million SAAR in September (Seasonally Adjusted Annual Rate).
Freddie Mac House Price Index Increased in September to New High; Up 5.2% Year-over-year
by Calculated Risk on 10/31/2023 03:59:00 PM
Today, in the Calculated Risk Real Estate Newsletter: Freddie Mac House Price Index Increased in September to New High; Up 5.2% Year-over-year
A brief excerpt:
On a year-over-year basis, the National FMHPI was up 5.2% in September, from up 4.3% YoY in August. The YoY increase peaked at 19.1% in July 2021, and for this cycle, bottomed at up 0.9% in May 2023. ...There is much more in the article. You can subscribe at https://calculatedrisk.substack.com/
In August, 10 states and D.C. were below their previous peaks, Seasonally Adjusted. The largest seasonally adjusted declines from the recent peak were in Idaho (-3.1%), Utah (-3.0%), Nevada (-2.3%), and Arizona (-1.8%).
For cities (Core-based Statistical Areas, CBSA), here are the 30 cities with the largest declines from the peak, seasonally adjusted. Austin continues to be the worst performing city.
...
I’ll have an update on the House Price Battle Royale: Low Inventory vs Affordability soon.

Las Vegas September 2023: Visitor Traffic Down Slightly YoY; Convention Traffic Up 9%
by Calculated Risk on 10/31/2023 02:44:00 PM
From the Las Vegas Visitor Authority: August 2023 Las Vegas Visitor Statistics
Las Vegas hosted more than 3.3M visitors in September, slightly behind (‐0.5%) last September while est. convention attendance for the month was up 9.5%, supported in part by the PACK Expo tradeshow (32k attendees) that rotated back into the destination since its last Vegas show in 2021.
Overall hotel occupancy reached 82.6% for the month (‐0.5 pts YoY) as Weekend occupancy came in at 89.0% (‐3.1 pts YoY), and Midweek occupancy reached 78.9%, surpassing last September by 0.3 pts.
ADR exceeded $201 for the month, +7.7% YoY while RevPAR exceeded $166, +7.0% YoY.
 Click on graph for larger image.
 The first graph shows visitor traffic for 2019 (Black), 2020 (light blue), 2021 (purple), 2022 (orange), and 2023 (red).
Visitor traffic was down 0.5% compared to last September.
Visitor traffic was down 4.0% compared to the same month in 2019.
Note: There was almost no convention traffic from April 2020 through May 2021.
The second graph shows convention traffic.
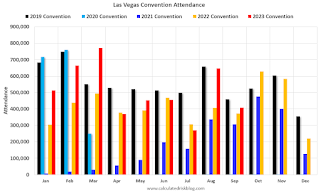
Convention traffic was up 9.5% compared to September 2022, and down 11.2% compared to September 2019.
Note: There was almost no convention traffic from April 2020 through May 2021.
HVS: Q3 2023 Homeownership and Vacancy Rates; Rental Vacancy Rates Increased
by Calculated Risk on 10/31/2023 11:21:00 AM
The Census Bureau released the Residential Vacancies and Homeownership report for Q3 2023 today.
The results of this survey were significantly distorted by the pandemic in 2020.
This report is frequently mentioned by analysts and the media to track household formation, the homeownership rate, and the homeowner and rental vacancy rates. However, there are serious questions about the accuracy of this survey.
This survey might show the trend, but I wouldn't rely on the absolute numbers. Analysts probably shouldn't use the HVS to estimate the excess vacant supply or household formation, or rely on the homeownership rate, except as a guide to the trend.
National vacancy rates in the third quarter 2023 were 6.6 percent for rental housing and 0.8 percent for homeowner housing. The rental vacancy rate was higher than the rate in the third quarter 2022 (6.0 percent) and higher than the rate in the second quarter 2023 (6.3 percent).
The homeowner vacancy rate of 0.8 percent was not statistically different than the rate in the third quarter 2022 (0.9 percent) and higher than the rate in the second quarter 2023 (0.7 percent).
The homeownership rate of 66.0 percent was virtually the same as the rate in the third quarter 2022 (66.0 percent) and not statistically different from the rate in the second quarter 2023 (65.9 percent).
emphasis added
 Click on graph for larger image.
The Red dots are the decennial Census homeownership rates for April 1st, 1990, 2000, 2010, and 2020.
The HVS homeownership rate increased slightly to 66.0% in Q3, from 65.9% in Q2.
The HVS homeownership rate increased slightly to 66.0% in Q3, from 65.9% in Q2.
The results in Q2 and Q3 2020 were distorted by the pandemic and should be ignored.
 The HVS homeowner vacancy increased to 0.8% in Q3 from 0.7% in Q2.
 Once again - this probably shows the general trend, but I wouldn't rely on the absolute numbers.
 The rental vacancy rate increased to 6.6% in Q3 from 6.3% in Q2. This is up from 6.0% in Q3 2022.
The quarterly HVS is the timeliest survey on households, but there are many questions about the accuracy of this survey.
Comments on August Case-Shiller and FHFA House Prices
by Calculated Risk on 10/31/2023 10:18:00 AM
Today, in the Calculated Risk Real Estate Newsletter: Case-Shiller: National House Price Index Up 2.6% year-over-year in August; New all-time High
Excerpt:
S&P/Case-Shiller released the monthly Home Price Indices for August ("August" is a 3-month average of June, July and August closing prices). August closing prices include some contracts signed in April, so there is a significant lag to this data. Here is a graph of the month-over-month (MoM) change in the Case-Shiller National Index Seasonally Adjusted (SA).
The MoM increase in the seasonally adjusted Case-Shiller National Index was at 0.9%. This was the seventh consecutive MoM increase following seven straight MoM decreases.
On a seasonally adjusted basis, prices increased in 19 of the 20 Case-Shiller cities on a month-to-month basis (Cleveland saw prices decline MoM). Seasonally adjusted, San Francisco has fallen 9.5% from the recent peak, Seattle is down 7.3% from the peak, Las Vegas is down 6.5%, and Phoenix is down 6.1%.

There is much more in the article. You can subscribe at https://calculatedrisk.substack.com/
Case-Shiller: National House Price Index Up 2.6% year-over-year in August; New all-time High
by Calculated Risk on 10/31/2023 09:30:00 AM
S&P/Case-Shiller released the monthly Home Price Indices for August ("August" is a 3-month average of June, July and August closing prices).
This release includes prices for 20 individual cities, two composite indices (for 10 cities and 20 cities) and the monthly National index.
From S&P S&P CoreLogic Case-Shiller Index Continues to Trend Upward in August
 Click on graph for larger image.
The first graph shows the nominal seasonally adjusted Composite 10, Composite 20 and National indices (the Composite 20 was started in January 2000).
The Composite 10 index is up 1.0% in August (SA) and is at a new all-time high.
The Composite 20 index is up 1.0% (SA) in August and is also at a new all-time high.
The National index is up 0.9% (SA) in August and is also at a new all-time high.
 The second graph shows the year-over-year change in all three indices.
The Composite 10 SA is up 3.0% year-over-year. The Composite 20 SA is up 2.2% year-over-year.
The National index SA is up 2.6% year-over-year.
Annual price changes were close to expectations. I'll have more later.
Monday, October 30, 2023
Tuesday: Case-Shiller House Prices, Chicago PMI, Housing Vacancies and Homeownership
by Calculated Risk on 10/30/2023 07:51:00 PM
 From Matthew Graham at Mortgage News Daily: Mortgages Rates Just Barely Higher. Bigger Moves Are Likely Ahead
Mortgage rates barely budged today. The average lender was just a hair higher compared to Friday's top tier conventional 30yr fixed rate offerings.Tuesday:
...
The biggest risk (or opportunity) involves a cohesive message across multiple economic reports and events. In other words, if the economic data on Tue-Fri sends the same message as the Fed announcement on Wednesday, and if a handful of other relevant events argue the same case, rates could move significantly higher or lower by Friday afternoon. [30 year fixed 7.92%]
emphasis added
• At 9:00 AM ET, S&P/Case-Shiller House Price Index for August. The consensus is for the Composite 20 index to be up 0.1% year-over-year.
• Also at 9:00 AM, FHFA House Price Index for August. This was originally a GSE only repeat sales, however there is also an expanded index.
• At 9:45 AM, Chicago Purchasing Managers Index for October. The consensus is for a reading of 44.8, up from 44.1 in September.
• At 10:00 AM, The Q3 Housing Vacancies and Homeownership report from the Census Bureau.
Goldman: 2024 Inflation Outlook
by Calculated Risk on 10/30/2023 01:34:00 PM
A few excerpts from a note by Goldman Sachs economists Spencer Hill and Manuel Abecasis: 2024 Inflation Outlook: Approaching the Target
"We are lowering our December 2024 core CPI forecast by two tenths to 2.7% year-on-year, and we continue to expect a significant decline in core PCE inflation from 3.7% currently to 2.4% in December 2024. We expect the backdrop of falling but above-target inflation to validate the Fed’s decision to hold the fed funds rate at its current level until 2024Q4."Currently the FOMC is projecting core PCE inflation to decline to 2.5% to 2.8% year-over-year (YoY) in Q4 2024. The Goldman Sachs projection is 2.4% by December 2024. Two of the key reasons that YoY inflation will likely continue to decline is wage growth has slowed (and appears likely to continue to slow), and shelter inflation will decline sharply in 2024.
And here is a graph of the year-over-year change in shelter from the CPI report and housing from the PCE report through September 2023.
 CPI Shelter was up 7.1% year-over-year in September, down from 7.2% in August, and down from the cycle peak of 8.2% in March 2023.
Housing (PCE) was up 7.2% YoY in September, down from 7.4% in August, and down from the cycle peak of 8.3% in April 2023.
Since asking rents are slightly negative year-over-year, these measures will continue to slow over coming months.
Since asking rents are slightly negative year-over-year, these measures will continue to slow over coming months.
Note that core CPI ex-shelter was up 1.9% YoY in September, down from 2.3% in August. And over the last 4 months, core CPI ex-shelter has increased at a 0.8% annual rate.
Housing October 30th Weekly Update: Inventory increased 1.5% Week-over-week; Down 2.7% Year-over-year
by Calculated Risk on 10/30/2023 08:17:00 AM
Altos reports that active single-family inventory was up 1.5% week-over-week.
 Click on graph for larger image.
This inventory graph is courtesy of Altos Research.
As of October 27th, inventory was at 563 thousand (7-day average), compared to 554 thousand the prior week.
Year-to-date, inventory is up 14.6%. And inventory is up 38.5% from the seasonal bottom 28 weeks ago.

The red line is for 2023. The black line is for 2019. Note that inventory is up from the record low for the same week in 2021, but below last year and still well below normal levels.
Inventory was down 2.7% compared to the same week in 2022 (last week it was down 3.2%), and down 39.4% compared to the same week in 2019 (last week down 40.7%).
In 2022, inventory peaked the same week one year ago (the latest in the year inventory has peaked), and it is possible inventory will peak even later this year! I now expect inventory to be up YoY soon.
Inventory is now 2.4% above the same week in 2020 levels (dark blue line).
Mike Simonsen discusses this data regularly on Youtube.
Sunday, October 29, 2023
Sunday Night Futures
by Calculated Risk on 10/29/2023 07:30:00 PM
Weekend:
• Schedule for Week of October 29, 2023
• FOMC Preview: No Change to Policy Expected
Monday:
• At 10:30 AM ET, Dallas Fed Survey of Manufacturing Activity for October. This is the last regional Fed survey for October.
From CNBC: Pre-Market Data and Bloomberg futures S&P 500 futures are up 10 and DOW futures are up 30 (fair value).
Oil prices were down over the last week with WTI futures at $84.46 per barrel and Brent at $89.39 per barrel. A year ago, WTI was at $88, and Brent was at $95 - so WTI oil prices were down 5% year-over-year.
Here is a graph from Gasbuddy.com for nationwide gasoline prices. Nationally prices are at $3.44 per gallon. A year ago, prices were at $3.72 per gallon, so gasoline prices are down $0.28 year-over-year.


