 RSS Feed
 by Calculated Risk on 11/01/2023 10:23:00 AM
Wednesday, November 01, 2023
Construction Spending Increased 0.4% in September
From the Census Bureau reported that overall construction spending increased:
Construction spending during September 2023 was estimated at a seasonally adjusted annual rate of $1,996.5 billion, 0.4 percent above the revised August estimate of $1,988.3 billion.Both private and public spending increased:
emphasis added
Spending on private construction was at a seasonally adjusted annual rate of $1,555.9 billion, 0.4 percent above the revised August estimate of $1,549.6 billion. ...
In September, the estimated seasonally adjusted annual rate of public construction spending was $440.6 billion, 0.4 percent above the revised August estimate of $438.7 billion.
 Click on graph for larger image.
This graph shows private residential and nonresidential construction spending, and public spending, since 1993. Note: nominal dollars, not inflation adjusted.
Residential (red) spending is 10.1% below the recent peak.
Non-residential (blue) spending is at a new peak.
Public construction spending is also at a new peak.
 The second graph shows the year-over-year change in construction spending.
On a year-over-year basis, private residential construction spending is down 2.2%. Non-residential spending is up 21.3% year-over-year. Public spending is up 15.5% year-over-year.
This was at consensus expectations for 0.4% increase in spending. Total construction spending for the previous two months was mostly unchanged, combined.
ISM® Manufacturing index Decreased to 46.7% in October
by Calculated Risk on 11/01/2023 10:12:00 AM
(Posted with permission). The ISM manufacturing index indicated contraction. The PMI® was at 46.7% in October, down from 49.0% in September. The employment index was at 46.8%, down from 51.2% the previous month, and the new orders index was at 45.5%, down from 49.2%.
From ISM: Manufacturing PMI® at 46.7%
October 2023 Manufacturing ISM® Report On Business®
Economic activity in the manufacturing sector contracted in October for the 12th consecutive month following a 28-month period of growth, say the nation's supply executives in the latest Manufacturing ISM® Report On Business®.This suggests manufacturing contracted in October. This was below the consensus forecast. Note that the price index was at 45.1% (falling prices).
The report was issued today by Timothy R. Fiore, CPSM, C.P.M., Chair of the Institute for Supply Management® (ISM®) Manufacturing Business Survey Committee:
“The Manufacturing PMI® registered 46.7 percent in October, 2.3 percentage points lower than the 49 percent recorded in September. The overall economy dropped back into contraction after one month of weak expansion preceded by nine months of contraction and a 30-month period of expansion before that. (A Manufacturing PMI® above 48.7 percent, over a period of time, generally indicates an expansion of the overall economy.) The New Orders Index remained in contraction territory at 45.5 percent, 3.7 percentage points lower than the figure of 49.2 percent recorded in September. The Production Index reading of 50.4 percent is a 2.1-percentage point decrease compared to September’s figure of 52.5 percent. The Prices Index registered 45.1 percent, up 1.3 percentage points compared to the reading of 43.8 percent in September. The Backlog of Orders Index registered 42.2 percent, 0.2 percentage point lower than the September reading of 42.4 percent. The Employment Index registered 46.8 percent, down 4.4 percentage points from the 51.2 percent reported in September.
emphasis added
BLS: Job Openings "Little Changed" at 9.6 million in September
by Calculated Risk on 11/01/2023 10:06:00 AM
From the BLS: Job Openings and Labor Turnover Summary
The number of job openings changed little at 9.6 million on the last business day of September, the U.S. Bureau of Labor Statistics reported today. Over the month, the number of hires and total separations changed little at 5.9 million and 5.5 million, respectively. Within separations, quits (3.7 million) and layoffs and discharges (1.5 million) changed little.The following graph shows job openings (black line), hires (dark blue), Layoff, Discharges and other (red column), and Quits (light blue column) from the JOLTS.
emphasis added
This series started in December 2000.
Note: The difference between JOLTS hires and separations is similar to the CES (payroll survey) net jobs headline numbers. This report is for September; the employment report this Friday will be for October.
 Click on graph for larger image.
Note that hires (dark blue) and total separations (red and light blue columns stacked) are usually pretty close each month. This is a measure of labor market turnover. When the blue line is above the two stacked columns, the economy is adding net jobs - when it is below the columns, the economy is losing jobs.
The spike in layoffs and discharges in March 2020 is labeled, but off the chart to better show the usual data.
Jobs openings increased in September to 9.55 million from 9.50 million in August.
The number of job openings (black) were down 12% year-over-year.
Quits were down 10% year-over-year. These are voluntary separations. (See light blue columns at bottom of graph for trend for "quits").
ADP: Private Employment Increased 113,000 in October
by Calculated Risk on 11/01/2023 08:15:00 AM
Private sector employment increased by 113,000 jobs in October and annual pay was up 5.7 percent year-over-year, according to the October ADP® National Employment ReportTM produced by the ADP Research Institute® in collaboration with the Stanford Digital Economy Lab (“Stanford Lab”). The ADP National Employment Report is an independent measure and high-frequency view of the private-sector labor market based on actual, anonymized payroll data of more than 25 million U.S. employees.This was below the consensus forecast of 135,000. The BLS report will be released Friday, and the consensus is for 168 thousand non-farm payroll jobs added in October.
...
“No single industry dominated hiring this month, and big post-pandemic pay increases seem to be behind us,” said Nela Richardson, chief economist, ADP. “In all, October's numbers paint a well-rounded jobs picture. And while the labor market has slowed, it's still enough to support strong consumer spending.”
emphasis added
MBA: Mortgage Applications Decreased in Weekly Survey
by Calculated Risk on 11/01/2023 07:00:00 AM
From the MBA: Mortgage Applications Decrease in Latest MBA Weekly Survey
Mortgage applications decreased 2.1 percent from one week earlier, according to data from the Mortgage Bankers Association’s (MBA) Weekly Mortgage Applications Survey for the week ending October 27, 2023.
The Market Composite Index, a measure of mortgage loan application volume, decreased 2.1 percent on a seasonally adjusted basis from one week earlier. On an unadjusted basis, the Index decreased 3 percent compared with the previous week. The Refinance Index decreased 4 percent from the previous week and was 12 percent lower than the same week one year ago. The seasonally adjusted Purchase Index decreased 1 percent from one week earlier. The unadjusted Purchase Index decreased 2 percent compared with the previous week and was 22 percent lower than the same week one year ago.
“Mortgage applications declined for the third straight week as mortgage rates remained elevated, with all rates around 30 basis points higher than they were a month ago. The 30-year fixed rate dipped slightly to 7.86 percent but remained close to 23-year highs and has been above the 7-percent level since early August 2023,” said Joel Kan, MBA’s Vice President and Deputy Chief Economist. “The impact of higher rates continued to be felt across both purchase and refinance markets. Purchase applications decreased to their lowest level since 1995 and refinance applications to the lowest level since January 2023. Applications for government loans saw much larger weekly declines than conventional, with government purchase applications down 3 percent and refinances down 9 percent."
Added Kan, "As higher rates continue to impact affordability and purchasing power, ARM loans increased almost 10 percent last week and continued to gain share, growing to 10.7 percent of all applications.”
...
The average contract interest rate for 30-year fixed-rate mortgages with conforming loan balances ($726,200 or less) decreased to 7.86 percent from 7.90 percent, with points decreasing to 0.73 from 0.77 (including the origination fee) for 80 percent loan-to-value ratio (LTV) loans.
emphasis added
 Click on graph for larger image.
The first graph shows the MBA mortgage purchase index.
According to the MBA, purchase activity is down 22% year-over-year unadjusted.
Red is a four-week average (blue is weekly). The purchase index is at the lowest level since 1995.

The second graph shows the refinance index since 1990.
With higher mortgage rates, the refinance index declined sharply in 2022 - and has mostly flat lined at a low level since then.
Tuesday, October 31, 2023
Wednesday: FOMC Statement, Job Openings, Vehicle Sales, ISM Manufacturing and More
by Calculated Risk on 10/31/2023 08:19:00 PM
 Note: Mortgage rates are from MortgageNewsDaily.com and are for top tier scenarios.
Wednesday:
• At 7:00 AM ET, The Mortgage Bankers Association (MBA) will release the results for the mortgage purchase applications index.
• At 8:15 AM, The ADP Employment Report for October. This report is for private payrolls only (no government). The consensus is for 135,000 jobs added, up from 89,000 in September.
• At 10:00 AM, Job Openings and Labor Turnover Survey for August from the BLS.
• At 10:00 AM, ISM Manufacturing Index for October. The consensus is for 49.0, unchanged from 49.0.
• At 10:00 AM, Construction Spending for September. The consensus is for 0.4% increase in spending.
• At 2:00 PM, FOMC Meeting Announcement. No change to FOMC policy is expected at this meeting.
• At 2:30 PM, Fed Chair Jerome Powell holds a press briefing following the FOMC announcement.
• All day: Light vehicle sales for October. The consensus is for sales of 15.1 million SAAR, down from 15.7 million SAAR in September (Seasonally Adjusted Annual Rate).
Freddie Mac House Price Index Increased in September to New High; Up 5.2% Year-over-year
by Calculated Risk on 10/31/2023 03:59:00 PM
Today, in the Calculated Risk Real Estate Newsletter: Freddie Mac House Price Index Increased in September to New High; Up 5.2% Year-over-year
A brief excerpt:
On a year-over-year basis, the National FMHPI was up 5.2% in September, from up 4.3% YoY in August. The YoY increase peaked at 19.1% in July 2021, and for this cycle, bottomed at up 0.9% in May 2023. ...There is much more in the article. You can subscribe at https://calculatedrisk.substack.com/
In August, 10 states and D.C. were below their previous peaks, Seasonally Adjusted. The largest seasonally adjusted declines from the recent peak were in Idaho (-3.1%), Utah (-3.0%), Nevada (-2.3%), and Arizona (-1.8%).
For cities (Core-based Statistical Areas, CBSA), here are the 30 cities with the largest declines from the peak, seasonally adjusted. Austin continues to be the worst performing city.
...
I’ll have an update on the House Price Battle Royale: Low Inventory vs Affordability soon.

Las Vegas September 2023: Visitor Traffic Down Slightly YoY; Convention Traffic Up 9%
by Calculated Risk on 10/31/2023 02:44:00 PM
From the Las Vegas Visitor Authority: August 2023 Las Vegas Visitor Statistics
Las Vegas hosted more than 3.3M visitors in September, slightly behind (‐0.5%) last September while est. convention attendance for the month was up 9.5%, supported in part by the PACK Expo tradeshow (32k attendees) that rotated back into the destination since its last Vegas show in 2021.
Overall hotel occupancy reached 82.6% for the month (‐0.5 pts YoY) as Weekend occupancy came in at 89.0% (‐3.1 pts YoY), and Midweek occupancy reached 78.9%, surpassing last September by 0.3 pts.
ADR exceeded $201 for the month, +7.7% YoY while RevPAR exceeded $166, +7.0% YoY.
 Click on graph for larger image.
 The first graph shows visitor traffic for 2019 (Black), 2020 (light blue), 2021 (purple), 2022 (orange), and 2023 (red).
Visitor traffic was down 0.5% compared to last September.
Visitor traffic was down 4.0% compared to the same month in 2019.
Note: There was almost no convention traffic from April 2020 through May 2021.
The second graph shows convention traffic.
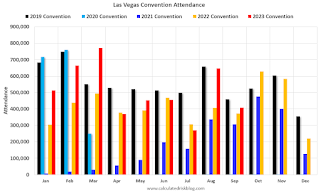
Convention traffic was up 9.5% compared to September 2022, and down 11.2% compared to September 2019.
Note: There was almost no convention traffic from April 2020 through May 2021.
HVS: Q3 2023 Homeownership and Vacancy Rates; Rental Vacancy Rates Increased
by Calculated Risk on 10/31/2023 11:21:00 AM
The Census Bureau released the Residential Vacancies and Homeownership report for Q3 2023 today.
The results of this survey were significantly distorted by the pandemic in 2020.
This report is frequently mentioned by analysts and the media to track household formation, the homeownership rate, and the homeowner and rental vacancy rates. However, there are serious questions about the accuracy of this survey.
This survey might show the trend, but I wouldn't rely on the absolute numbers. Analysts probably shouldn't use the HVS to estimate the excess vacant supply or household formation, or rely on the homeownership rate, except as a guide to the trend.
National vacancy rates in the third quarter 2023 were 6.6 percent for rental housing and 0.8 percent for homeowner housing. The rental vacancy rate was higher than the rate in the third quarter 2022 (6.0 percent) and higher than the rate in the second quarter 2023 (6.3 percent).
The homeowner vacancy rate of 0.8 percent was not statistically different than the rate in the third quarter 2022 (0.9 percent) and higher than the rate in the second quarter 2023 (0.7 percent).
The homeownership rate of 66.0 percent was virtually the same as the rate in the third quarter 2022 (66.0 percent) and not statistically different from the rate in the second quarter 2023 (65.9 percent).
emphasis added
 Click on graph for larger image.
The Red dots are the decennial Census homeownership rates for April 1st, 1990, 2000, 2010, and 2020.
The HVS homeownership rate increased slightly to 66.0% in Q3, from 65.9% in Q2.
The HVS homeownership rate increased slightly to 66.0% in Q3, from 65.9% in Q2.
The results in Q2 and Q3 2020 were distorted by the pandemic and should be ignored.
 The HVS homeowner vacancy increased to 0.8% in Q3 from 0.7% in Q2.
 Once again - this probably shows the general trend, but I wouldn't rely on the absolute numbers.
 The rental vacancy rate increased to 6.6% in Q3 from 6.3% in Q2. This is up from 6.0% in Q3 2022.
The quarterly HVS is the timeliest survey on households, but there are many questions about the accuracy of this survey.
Comments on August Case-Shiller and FHFA House Prices
by Calculated Risk on 10/31/2023 10:18:00 AM
Today, in the Calculated Risk Real Estate Newsletter: Case-Shiller: National House Price Index Up 2.6% year-over-year in August; New all-time High
Excerpt:
S&P/Case-Shiller released the monthly Home Price Indices for August ("August" is a 3-month average of June, July and August closing prices). August closing prices include some contracts signed in April, so there is a significant lag to this data. Here is a graph of the month-over-month (MoM) change in the Case-Shiller National Index Seasonally Adjusted (SA).
The MoM increase in the seasonally adjusted Case-Shiller National Index was at 0.9%. This was the seventh consecutive MoM increase following seven straight MoM decreases.
On a seasonally adjusted basis, prices increased in 19 of the 20 Case-Shiller cities on a month-to-month basis (Cleveland saw prices decline MoM). Seasonally adjusted, San Francisco has fallen 9.5% from the recent peak, Seattle is down 7.3% from the peak, Las Vegas is down 6.5%, and Phoenix is down 6.1%.

There is much more in the article. You can subscribe at https://calculatedrisk.substack.com/


