by Calculated Risk on 11/02/2023 03:56:00 PM
Thursday, November 02, 2023
October Employment Preview
On Friday at 8:30 AM ET, the BLS will release the employment report for October. The consensus is for 168,000 jobs added, and for the unemployment rate to be unchanged at 3.8%.
From BofA economists:
"For the October employment report, we forecast nonfarm payroll job growth will slow from 336k in September to 230k ... Given our expectation for the participation rate to hold at 62.8% and for job growth to be strong, we expect the unemployment rate will fall to 3.7% from 3.8%."From Goldman Sachs:
"We estimate nonfarm payrolls rose by 195k in October ... tight labor markets may have incentivized a pull-forward of pre-holiday hiring, for example in the retail sector. ... We estimate that the unemployment rate declined to 3.7% ... Our forecast reflects a solid rise in household employment—striking workers are counted as employed in the household survey—and unchanged labor force participation at 62.8%."• ADP Report: The ADP employment report showed 113,000 private sector jobs were added in October. This suggests job gains below consensus expectations, however, in general, ADP hasn't been very useful in forecasting the BLS report.
• ISM Surveys: Note that the ISM surveys are diffusion indexes based on the number of firms hiring (not the number of hires). The ISM® manufacturing employment index decreased in October to 46.8%, down from 51.2% the previous month. This would suggest about 35,000 jobs lost in manufacturing. The ADP report indicated 3,000 manufacturing jobs gained in October.
The ISM® services employment index will be released tomorrow.
• Unemployment Claims: The weekly claims report showed about the same number of initial unemployment claims during the reference week (includes the 12th of the month) from 202,000 in September to 200,000 in October. This suggests about the same number of layoffs in October as in September.
Realtor.com Reports Weekly New Listings UP 5.6% YoY; Active Inventory Down 1.0% YoY
by Calculated Risk on 11/02/2023 01:40:00 PM
Realtor.com has monthly and weekly data on the existing home market. Here is their weekly report: Weekly Housing Trends View — Data Week Ending Oct 28, 2023
• Active inventory declined, with for-sale homes lagging behind year ago levels by 1.0%.
For 19 straight weeks, the number of homes available for sale has registered below that of the previous year.
• New listings–a measure of sellers putting homes up for sale–were up this week, by 5.6% from one year ago.
Since mid-2022, new listings have registered lower than prior year levels, as the mortgage rate lock-in effect freezes homeowners with low-rate existing mortgages in place. This past week, the trend abruptly reversed as new listings during the week outpaced the same week in the previous year by 5.6%. While growth in new listings is a needed step for the market to return to normal, this growth rate reflects a rapid decline last year compared to a more stable newly listed homes pace this year, as we are lapping a period of time last year when new listing activity was unseasonably low due to the said mortgage rate lock-in effect.
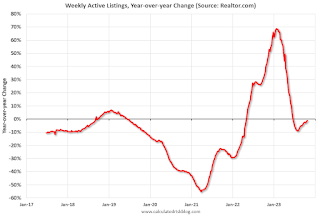
 Here is a graph of the year-over-year change in inventory according to realtor.com.
 Inventory was down 1.0% year-over-year - this was the 19th consecutive week with a YoY decrease following 58 consecutive weeks with a YoY increase in inventory.
Asking Rents Down 1.2% Year-over-year
by Calculated Risk on 11/02/2023 11:03:00 AM
Today, in the Calculated Risk Real Estate Newsletter: Asking Rents Down 1.2% Year-over-year
A brief excerpt:
Tracking rents is important for understanding the dynamics of the housing market. For example, the sharp increase in rents helped me deduce that there was a surge in household formation in 2021 (See from September 2021: Household Formation Drives Housing Demand).There is much more in the article. You can subscribe at https://calculatedrisk.substack.com/
The surge in household formation has been confirmed (mostly due to work-from-home), and this led to the supposition that household formation would slow sharply in 2023 (mostly confirmed) and that asking rents might decrease in 2023 on a year-over-year basis (now negative year-over-year).
Recent data suggests household formation has slowed sharply and asking rents are declining year-over-year. With a near record number of multi-family units under construction, slow household formation, rising vacancy rates, and soft rents, most builders expect to start fewer multi-family units in 2024.
Rick Palacios Jr., Director of Research at John Burns Research and Consulting noted yesterday:
Apartment developers and investors we just surveyed expect a big drop in starts over the next 12 months....
25% expect apartment starts to fall by 50%+, and 52% expect a drop of 20%+. Very, very few expect growth ahead.
With slow household formation, more supply coming on the market and a rising rental vacancy rate, rents will be under pressure all year and multi-family starts will decline in 2024. See: Forecast: Multifamily Starts will Decline Sharply
Weekly Initial Unemployment Claims Increase to 217,000
by Calculated Risk on 11/02/2023 08:30:00 AM
The DOL reported:
In the week ending October 28, the advance figure for seasonally adjusted initial claims was 217,000, an increase of 5,000 from the previous week's revised level. The previous week's level was revised up by 2,000 from 210,000 to 212,000. The 4-week moving average was 210,000, an increase of 2,000 from the previous week's revised average. The previous week's average was revised up by 500 from 207,500 to 208,000.The following graph shows the 4-week moving average of weekly claims since 1971.
emphasis added
 Click on graph for larger image.
The dashed line on the graph is the current 4-week average. The four-week average of weekly unemployment claims increased to 210,000.
The previous week was revised up.
Weekly claims were sligthly higher than the consensus forecast.
Wednesday, November 01, 2023
Thursday: Unemployment Claims
by Calculated Risk on 11/01/2023 08:56:00 PM

Thursday:
• At 8:30 AM: The initial weekly unemployment claims report will be released. The consensus is for 214 thousand initial claims, up from 210 thousand last week.
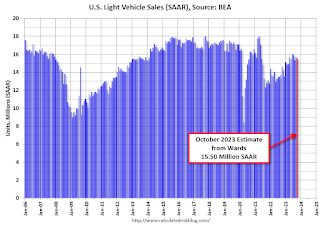
Vehicles Sales decrease to 15.5 million SAAR in October; Up 6% YoY
by Calculated Risk on 11/01/2023 05:11:00 PM
Wards Auto released their estimate of light vehicle sales for October: October U.S. Light-Vehicle Sales Miss Expectations but Still Record 6% Increase (pay site).
October’s results were below expectations, apparently due to weakness at the end of the month. Most automakers finished below mid-month projections for each, thus the industry’s overall weaker results can’t be blamed on underestimating the impacts to Ford, GM and Stellantis from the strike-related plant shutdowns. The results also show that other automakers did not benefit from losses at the Detroit 3. Still, most manufacturers recorded year-over-year gains and the industry posted its 14th straight increase.
 Click on graph for larger image.
This graph shows light vehicle sales since 2006 from the BEA (blue) and Wards Auto's estimate for September (red).
The impact of COVID-19 was significant, and April 2020 was the worst month. After April 2020, sales increased, and were close to sales in 2019 (the year before the pandemic). However, sales decreased in 2021 due to supply issues. The "supply chain bottom" was in September 2021.
 The second graph shows light vehicle sales since the BEA started keeping data in 1967.
 Sales in October were below Ward's forecast, but above the consensus forecast.
FOMC Statement: No Change to Rates
by Calculated Risk on 11/01/2023 02:00:00 PM
Fed Chair Powell press conference video here or on YouTube here, starting at 2:30 PM ET.
FOMC Statement:
Recent indicators suggest that economic activity expanded at a strong pace in the third quarter. Job gains have moderated since earlier in the year but remain strong, and the unemployment rate has remained low. Inflation remains elevated.
The U.S. banking system is sound and resilient. Tighter financial and credit conditions for households and businesses are likely to weigh on economic activity, hiring, and inflation. The extent of these effects remains uncertain. The Committee remains highly attentive to inflation risks.
The Committee seeks to achieve maximum employment and inflation at the rate of 2 percent over the longer run. In support of these goals, the Committee decided to maintain the target range for the federal funds rate at 5-1/4 to 5-1/2 percent. The Committee will continue to assess additional information and its implications for monetary policy. In determining the extent of additional policy firming that may be appropriate to return inflation to 2 percent over time, the Committee will take into account the cumulative tightening of monetary policy, the lags with which monetary policy affects economic activity and inflation, and economic and financial developments. In addition, the Committee will continue reducing its holdings of Treasury securities and agency debt and agency mortgage-backed securities, as described in its previously announced plans. The Committee is strongly committed to returning inflation to its 2 percent objective.
In assessing the appropriate stance of monetary policy, the Committee will continue to monitor the implications of incoming information for the economic outlook. The Committee would be prepared to adjust the stance of monetary policy as appropriate if risks emerge that could impede the attainment of the Committee's goals. The Committee's assessments will take into account a wide range of information, including readings on labor market conditions, inflation pressures and inflation expectations, and financial and international developments.
Voting for the monetary policy action were Jerome H. Powell, Chair; John C. Williams, Vice Chair; Michael S. Barr; Michelle W. Bowman; Lisa D. Cook; Austan D. Goolsbee; Patrick Harker; Philip N. Jefferson; Neel Kashkari; Adriana D. Kugler; Lorie K. Logan; and Christopher J. Waller.
emphasis added
Inflation Adjusted House Prices 3.1% Below Peak; Price-to-rent index is 7.0% below recent peak
by Calculated Risk on 11/01/2023 12:19:00 PM
Today, in the Calculated Risk Real Estate Newsletter: Inflation Adjusted House Prices 3.1% Below Peak; Price-to-rent index is 7.0% below recent peak
Excerpt:
It has been over 17 years since the bubble peak. In the August Case-Shiller house price index released yesterday, the seasonally adjusted National Index (SA), was reported as being 68% above the bubble peak in 2006. However, in real terms, the National index (SA) is about 9% above the bubble peak (and historically there has been an upward slope to real house prices). The composite 20, in real terms, is at the bubble peak.
People usually graph nominal house prices, but it is also important to look at prices in real terms. As an example, if a house price was $200,000 in January 2000, the price would be $362,000 today adjusted for inflation (81% increase). That is why the second graph below is important - this shows "real" prices.
The third graph shows the price-to-rent ratio, and the fourth graph is the affordability index. The last graph shows the 5-year real return based on the Case-Shiller National Index.
Construction Spending Increased 0.4% in September
by Calculated Risk on 11/01/2023 10:23:00 AM
From the Census Bureau reported that overall construction spending increased:
Construction spending during September 2023 was estimated at a seasonally adjusted annual rate of $1,996.5 billion, 0.4 percent above the revised August estimate of $1,988.3 billion.Both private and public spending increased:
emphasis added
Spending on private construction was at a seasonally adjusted annual rate of $1,555.9 billion, 0.4 percent above the revised August estimate of $1,549.6 billion. ...
In September, the estimated seasonally adjusted annual rate of public construction spending was $440.6 billion, 0.4 percent above the revised August estimate of $438.7 billion.
 Click on graph for larger image.
This graph shows private residential and nonresidential construction spending, and public spending, since 1993. Note: nominal dollars, not inflation adjusted.
Residential (red) spending is 10.1% below the recent peak.
Non-residential (blue) spending is at a new peak.
Public construction spending is also at a new peak.
 The second graph shows the year-over-year change in construction spending.
On a year-over-year basis, private residential construction spending is down 2.2%. Non-residential spending is up 21.3% year-over-year. Public spending is up 15.5% year-over-year.
ISM® Manufacturing index Decreased to 46.7% in October
by Calculated Risk on 11/01/2023 10:12:00 AM
(Posted with permission). The ISM manufacturing index indicated contraction. The PMI® was at 46.7% in October, down from 49.0% in September. The employment index was at 46.8%, down from 51.2% the previous month, and the new orders index was at 45.5%, down from 49.2%.
From ISM: Manufacturing PMI® at 46.7%
October 2023 Manufacturing ISM® Report On Business®
Economic activity in the manufacturing sector contracted in October for the 12th consecutive month following a 28-month period of growth, say the nation's supply executives in the latest Manufacturing ISM® Report On Business®.This suggests manufacturing contracted in October. This was below the consensus forecast. Note that the price index was at 45.1% (falling prices).
The report was issued today by Timothy R. Fiore, CPSM, C.P.M., Chair of the Institute for Supply Management® (ISM®) Manufacturing Business Survey Committee:
“The Manufacturing PMI® registered 46.7 percent in October, 2.3 percentage points lower than the 49 percent recorded in September. The overall economy dropped back into contraction after one month of weak expansion preceded by nine months of contraction and a 30-month period of expansion before that. (A Manufacturing PMI® above 48.7 percent, over a period of time, generally indicates an expansion of the overall economy.) The New Orders Index remained in contraction territory at 45.5 percent, 3.7 percentage points lower than the figure of 49.2 percent recorded in September. The Production Index reading of 50.4 percent is a 2.1-percentage point decrease compared to September’s figure of 52.5 percent. The Prices Index registered 45.1 percent, up 1.3 percentage points compared to the reading of 43.8 percent in September. The Backlog of Orders Index registered 42.2 percent, 0.2 percentage point lower than the September reading of 42.4 percent. The Employment Index registered 46.8 percent, down 4.4 percentage points from the 51.2 percent reported in September.
emphasis added


