by Calculated Risk on 11/05/2023 06:15:00 PM
Sunday, November 05, 2023
Monday: Senior Loan Officer Opinion Survey
Weekend:
• Schedule for Week of November 5, 2023
Monday:
• At 2:00 PM, Senior Loan Officer Opinion Survey on Bank Lending Practices (SLOOS) for October.
From CNBC: Pre-Market Data and Bloomberg futures S&P 500 futures are up 5 and DOW futures are up 40 (fair value).
Oil prices were down over the last week with WTI futures at $80.51 per barrel and Brent at $84.89 per barrel. A year ago, WTI was at $93, and Brent was at $100 - so WTI oil prices were down 13% year-over-year.
Here is a graph from Gasbuddy.com for nationwide gasoline prices. Nationally prices are at $3.37 per gallon. A year ago, prices were at $3.79 per gallon, so gasoline prices are down $0.42 year-over-year.
Hotels: Occupancy Rate Increased 0.7% Year-over-year
by Calculated Risk on 11/05/2023 08:21:00 AM
U.S. hotel performance decreased from the previous week but showed positive year-over-year comparisons, according to CoStar’s latest data through 28 October.The following graph shows the seasonal pattern for the hotel occupancy rate using the four-week average.
22-28 October 2023 (percentage change from comparable week in 2022):
• Occupancy: 66.0% (+0.7%)
• Average daily rate (ADR): US$160.89 (+3.9%)
• Revenue per available room (RevPAR): US$106.16 (+4.6%)
emphasis added
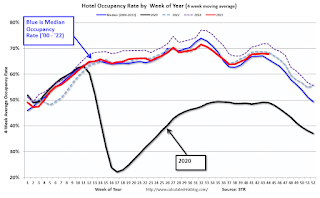 Click on graph for larger image.
The red line is for 2023, black is 2020, blue is the median, and dashed light blue is for 2022. Dashed purple is for 2018, the record year for hotel occupancy.
Saturday, November 04, 2023
Real Estate Newsletter Articles this Week: National House Price Index Up 2.6% year-over-year in August
by Calculated Risk on 11/04/2023 02:11:00 PM
At the Calculated Risk Real Estate Newsletter this week:
• Case-Shiller: National House Price Index Up 2.6% year-over-year in August; New all-time High
• Inflation Adjusted House Prices 3.1% Below Peak
• Freddie Mac House Price Index Increased in September to New High; Up 5.2% Year-over-year
• Asking Rents Down 1.2% Year-over-year
• Lawler: Single-Family Rent Results Invitation Homes, and AMH (American Homes 4 Rent)
This is usually published 4 to 6 times a week and provides more in-depth analysis of the housing market.
You can subscribe at https://calculatedrisk.substack.com/
Schedule for Week of November 5, 2023
by Calculated Risk on 11/04/2023 08:11:00 AM
This will be a light week for economic data.
2:00 PM: Senior Loan Officer Opinion Survey on Bank Lending Practices (SLOOS) for October.
8:00 AM ET: Corelogic House Price index for September.
 8:30 AM: Trade Balance report for September from the Census Bureau. The consensus is for the deficit to be $60.3 billion in September, from $58.3 billion in August.
This graph shows the U.S. trade deficit, with and without petroleum, through the most recent report.
The blue line is the total deficit, and the black line is the petroleum deficit, and the red line is the trade deficit ex-petroleum products.
11:00 AM: NY Fed: Q3 Quarterly Report on Household Debt and Credit
7:00 AM ET: The Mortgage Bankers Association (MBA) will release the results for the mortgage purchase applications index.
8:30 AM: The initial weekly unemployment claims report will be released. The consensus is for 221 thousand initial claims, up from 217 thousand last week.
Veterans Day Holiday: Most banks will be closed in observance of Veterans Day. The stock market will be open.
10:00 AM: University of Michigan's Consumer sentiment index (Preliminary for November).
Friday, November 03, 2023
Nov 3rd COVID Update: Deaths and Hospitalizations Decreased
by Calculated Risk on 11/03/2023 07:53:00 PM
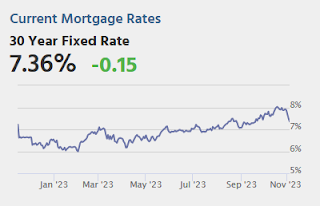
| COVID Metrics | ||||
|---|---|---|---|---|
| Now | Week Ago | Goal | ||
| Hospitalized2 | 12,953 | 13,264 | ≤3,0001 | |
| Deaths per Week2 | 1,143 | 1,262 | ≤3501 | |
| 1my goals to stop weekly posts, 2Weekly for Currently Hospitalized, and Deaths 🚩 Increasing number weekly for Hospitalized and Deaths ✅ Goal met. | ||||
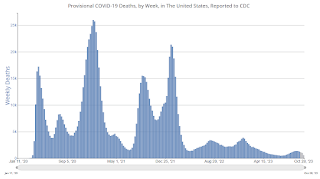 Click on graph for larger image.
This graph shows the weekly (columns) number of deaths reported.
AAR: October Rail Combined Carloads and Intermodal Highest Since June 2021
by Calculated Risk on 11/03/2023 04:54:00 PM
From the Association of American Railroads (AAR) Rail Time Indicators. Graphs and excerpts reprinted with permission.
Combined originated carloads and intermodal units on U.S. railroads averaged 499,331 per week in October 2023, the most for any month since June 2021 — a span of 28 months. Part of the increase relates to intermodal seasonality and concerns over Panama Canal capacity, but part also reflects an economy that remains resilient.
emphasis added
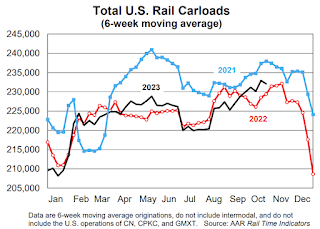 Click on graph for larger image.
This graph from the Rail Time Indicators report shows the six-week average of U.S. Carloads in 2021, 2022 and 2022:
Total originated carloads on U.S. railroads (not including the U.S. operations of Canadian and Mexican railroads) were down 0.3% (2,921 carloads) in October 2023 from October 2022, their fourth decline in the past five months. Total carloads averaged 230,398 per week in October 2023. That’s down fractionally from 230,429 in September 2023 but otherwise is the highest in a year.
 The second graph shows the six-week average (not monthly) of U.S. intermodal in 2021, 2022 and 2023: (using intermodal or shipping containers):
It’s too soon to say intermodal is back, but October’s numbers are encouraging. U.S. railroads averaged 268,933 intermodal originations per week in October 2023, up 2.2% over October 2022. That’s the second straight year-over-year gain (September was 0.7%) following 18 straight declines. It’s also the biggest weekly average for intermodal since May 2022.
Lawler: Single-Family Rent Results
by Calculated Risk on 11/03/2023 02:52:00 PM
Today, in the Calculated Risk Real Estate Newsletter: Lawler: Single-Family Rent Results
A brief excerpt:
[H]ere are the latest rent trends just reported from two of the largest publicly traded firms in the single-family rental industry: Invitation Homes, and AMH (American Homes 4 Rent). The rent trends are for “same store/same properties.”There is more in the article. You can subscribe at https://calculatedrisk.substack.com/
Note that while rental growth rates have clearly decelerated at both firms since 2022, the slowdown in rent growth has been nowhere near as large as that in the rent indexes shown above.
Heavy Truck Sales Decline in October, Unchanged YoY
by Calculated Risk on 11/03/2023 12:39:00 PM
This graph shows heavy truck sales since 1967 using data from the BEA. The dashed line is the October 2023 seasonally adjusted annual sales rate (SAAR).
Heavy truck sales really collapsed during the great recession, falling to a low of 180 thousand SAAR in May 2009. Then heavy truck sales increased to a new record high of 570 thousand SAAR in April 2019.
 Click on graph for larger image.
Note: "Heavy trucks - trucks more than 14,000 pounds gross vehicle weight."
Heavy truck sales declined sharply at the beginning of the pandemic, falling to a low of 308 thousand SAAR in May 2020.
As I noted earlier this week, Vehicles Sales decrease to 15.5 million SAAR in October; Up 6% YoY
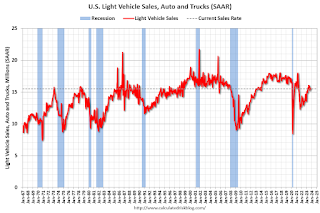 The second graph shows light vehicle sales since the BEA started keeping data in 1967. Vehicle sales were at 15.50 million SAAR in October, down from 15.68 million in September, and up 6% from 14.68 million in October 2022.
Comments on October Employment Report
by Calculated Risk on 11/03/2023 09:21:00 AM
The headline jobs number in the October employment report was below expectations, and employment for the previous two months was revised down by 101,000, combined. The participation rate and the employment population ratio both decreased, and the unemployment rate increased to 3.9%.
In October, the year-over-year employment change was 2.97 million jobs.
Seasonal Retail Hiring
Typically, retail companies start hiring for the holiday season in October, and really increase hiring in November. Here is a graph that shows the historical net retail jobs added for October, November and December by year.
 This graph really shows the collapse in retail hiring in 2008. Since then, seasonal hiring had increased back close to more normal levels. Note: I expect the long-term trend will be down with more and more internet holiday shopping.
Retailers hired 148 thousand workers Not Seasonally Adjusted (NSA) net in October. This was about the same as last year and suggests similar real retail sales this holiday season as last year.
Prime (25 to 54 Years Old) Participation
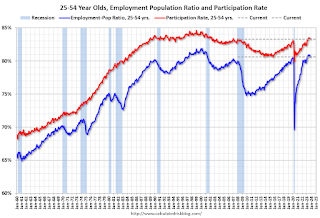 Since the overall participation rate is impacted by both cyclical (recession) and demographic (aging population, younger people staying in school) reasons, here is the employment-population ratio for the key working age group: 25 to 54 years old.
The 25 to 54 participation rate decreased in October to 83.3% from 83.5% in September, and the 25 to 54 employment population ratio declined to 80.6% from 80.8% the previous month.
Average Hourly Wages
 The graph shows the nominal year-over-year change in "Average Hourly Earnings" for all private employees from the Current Employment Statistics (CES).
 Wage growth has trended down after peaking at 5.9% YoY in March 2022 and was at 4.1% YoY in October.
Part Time for Economic Reasons
 From the BLS report:
"The number of persons employed part time for economic reasons, at 4.3 million, changed little in October. These individuals, who would have preferred full-time employment, were working part time because their hours had been reduced or they were unable to find full-time jobs."The number of persons working part time for economic reasons increased in October to 4.28 million from 4.07 million in September. This is below pre-recession levels.
These workers are included in the alternate measure of labor underutilization (U-6) that increased to 7.2% from 7.0% in the previous month. This is down from the record high in April 22.9% and up from the lowest level on record (seasonally adjusted) in December 2022 (6.5%). (This series started in 1994). This measure is above the 7.0% level in February 2020 (pre-pandemic).
Unemployed over 26 Weeks
 This graph shows the number of workers unemployed for 27 weeks or more.
 According to the BLS, there are 1.282 million workers who have been unemployed for more than 26 weeks and still want a job, up from 1.216 million the previous month.
This is above the pre-pandemic levels.
Job Streak
| Headline Jobs, Top 10 Streaks | ||
|---|---|---|
| Year Ended | Streak, Months | |
| 1 | 2019 | 100 |
| 2 | 1990 | 48 |
| 3 | 2007 | 46 |
| 4 | 1979 | 45 |
| 5 | 20231 | 34 |
| 6 tie | 1943 | 33 |
| 6 tie | 1986 | 33 |
| 6 tie | 2000 | 33 |
| 9 | 1967 | 29 |
| 10 | 1995 | 25 |
| 1Currrent Streak | ||
Summary:
The headline monthly jobs number was below consensus expectations and employment for the previous two months was revised down by 101,000, combined. The participation rate and the employment population ratio both decreased, and the unemployment rate increased to 3.9%.
October Employment Report: 150 thousand Jobs, 3.9% Unemployment Rate
by Calculated Risk on 11/03/2023 08:30:00 AM
From the BLS:
Total nonfarm payroll employment increased by 150,000 in October, and the unemployment rate changed little at 3.9 percent, the U.S. Bureau of Labor Statistics reported today. Job gains occurred in health care, government, and social assistance. Employment declined in manufacturing due to strike activity.
...
The change in total nonfarm payroll employment for August was revised down by 62,000, from +227,000 to +165,000, and the change for September was revised down by 39,000, from +336,000 to +297,000. With these revisions, employment in August and September combined is 101,000 lower than previously reported.
emphasis added
 Click on graph for larger image.
The first graph shows the jobs added per month since January 2021.
Payrolls for August and September were revised down 101 thousand, combined.
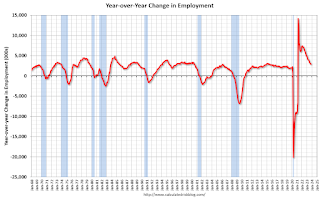 The second graph shows the year-over-year change in total non-farm employment since 1968.
In October, the year-over-year change was 2.97 million jobs. Employment was up solidly year-over-year but has slowed to more normal levels of job growth recently.
The third graph shows the employment population ratio and the participation rate.
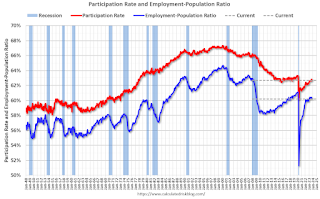 The Labor Force Participation Rate was decreased to 62.7% in October, from 62.8% in September. This is the percentage of the working age population in the labor force.
 The Employment-Population ratio decreased to 60.2% from 60.4% (blue line).
I'll post the 25 to 54 age group employment-population ratio graph later.
 The fourth graph shows the unemployment rate.
 The unemployment rate increased to 3.9% in October from 3.8% in September.
This was below consensus expectations, and August and September payrolls were revised down by 101,000 combined.


