 RSS Feed
 by Calculated Risk on 11/07/2023 10:48:00 AM
Tuesday, November 07, 2023
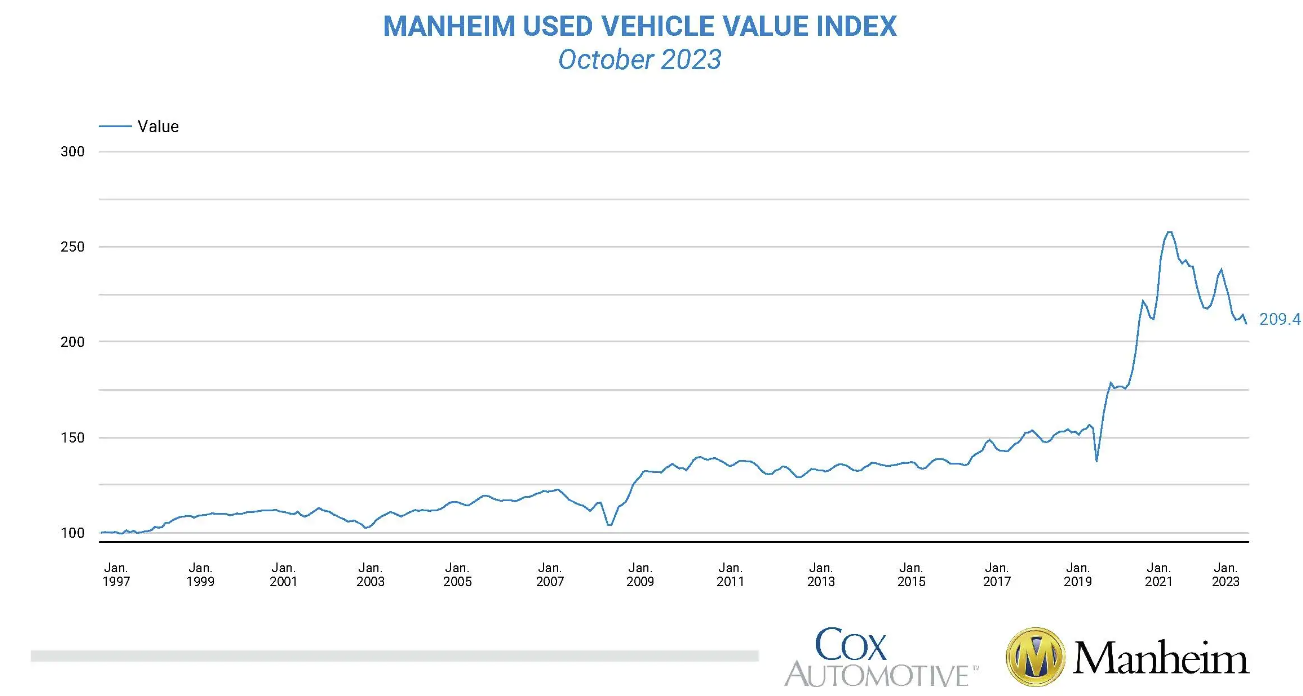
Wholesale Used Car Prices Decreased 2.3% in October; Down 4.0% Year-over-year
From Manheim Consulting today: Wholesale Used-Vehicle Prices Decrease in October
Wholesale used-vehicle prices (on a mix, mileage, and seasonally adjusted basis) decreased 2.3% in October from September. The Manheim Used Vehicle Value Index (MUVVI) dropped to 209.4, down 4.0% from a year ago.
“October revealed some not-so-spooky price moves, namely a reversal of the gains that were seen during the prior two months,” said Chris Frey, senior manager of Economic and Industry Insights for Cox Automotive. “This confirms the caution that was mentioned last month The UAW strike , avoiding one action that could have led to higher wholesale prices. October’s price decline is eerily similar to last October’s 2.2% drop, and this was not unexpected as the market remains balanced. Wholesale vehicle values typically experience some modest increases during the holiday season, and with two months remaining, we could see some upward price movements.”
The seasonal adjustment reduced the October decrease. The non-adjusted price in October declined by 3.1% compared to September, moving the unadjusted average price down 6.3% year over year.
emphasis added
 Click on graph for larger image.
This index from Manheim Consulting is based on all completed sales transactions at Manheim’s U.S. auctions.
The Manheim index suggests used car prices decreased in October (seasonally adjusted) and were down 4.0% year-over-year (YoY).
Trade Deficit increased to $61.5 Billion in September
by Calculated Risk on 11/07/2023 08:30:00 AM
The Census Bureau and the Bureau of Economic Analysis reported:
The U.S. Census Bureau and the U.S. Bureau of Economic Analysis announced today that the goods and services deficit was $61.5 billion in September, up $2.9 billion from $58.7 billion in August, revised.
September exports were $261.1 billion, $5.7 billion more than August exports. September imports were $322.7 billion, $8.6 billion more than August imports
emphasis added
 Click on graph for larger image.
Both exports and imports increased in September.
Exports are up slightly year-over-year; imports are down 3% year-over-year.
Both imports and exports decreased sharply due to COVID-19 and then bounced back - and both had been decreasing recently.
The second graph shows the U.S. trade deficit, with and without petroleum.
 The blue line is the total deficit, and the black line is the petroleum deficit, and the red line is the trade deficit ex-petroleum products.
Note that net, exports of petroleum products are positive.
The trade deficit with China decreased to $28.3 billion from $37.4 billion a year ago.
Monday, November 06, 2023
Tuesday: Trade Deficit
by Calculated Risk on 11/06/2023 07:45:00 PM
 From Matthew Graham at Mortgage News Daily: Mortgage Rates Erase Some of Last Week's Huge Improvement
In and of itself, today would rank among the handful of "worst days" of any given year in term of mortgage rate movement. In other words, comparing today's rates to Friday's shows a big jump relative to the average day. Specifically, most lenders are offering rates that are at least an eighth of a percent (.125%) higher versus Friday morning.Tuesday:
All that having been said, this is a prime opportunity to "put things in perspective." [30 year fixed 7.48%]
emphasis added
• At 8:00 AM ET, Corelogic House Price index for September.
• At 8:30 AM, Trade Balance report for September from the Census Bureau. The consensus is for the deficit to be $60.3 billion in September, from $58.3 billion in August.
• At 11:00 AM, NY Fed: Q3 Quarterly Report on Household Debt and Credit
Fed SLOOS Survey: Banks reported Tighter Standards, Weaker Demand for All Loan Types
by Calculated Risk on 11/06/2023 02:00:00 PM
From the Federal Reserve: The October 2023 Senior Loan Officer Opinion Survey on Bank Lending Practices
The October 2023 Senior Loan Officer Opinion Survey on Bank Lending Practices (SLOOS) addressed changes in the standards and terms on, and demand for, bank loans to businesses and households over the past three months, which generally correspond to the third quarter of 2023.
Regarding loans to businesses, survey respondents, on balance, reported tighter standards and weaker demand for commercial and industrial (C&I) loans to firms of all sizes over the third quarter. Furthermore, banks reported tighter standards and weaker demand for all commercial real estate (CRE) loan categories.
For loans to households, banks reported that lending standards tightened across all categories of residential real estate (RRE) loans other than government residential mortgages, for which standards remained basically unchanged. Meanwhile, demand weakened for all RRE loan categories. In addition, banks reported tighter standards and weaker demand for home equity lines of credit (HELOCs). Moreover, for credit card, auto, and other consumer loans, standards reportedly tightened, and demand weakened on balance.
emphasis added
 Click on graph for larger image.
This graph on Residential Real Estate demand is from the Senior Loan Officer Survey Charts.
This shows that demand has declined.
The left graph is 1990 to 2014. The right graph is 2015 to Q3 2023.
ICE (Black Knight) Mortgage Monitor: "It’s fair to expect prices to weaken later in 2023"
by Calculated Risk on 11/06/2023 10:14:00 AM
Today, in the Calculated Risk Real Estate Newsletter: ICE (Black Knight) Mortgage Monitor: "It’s fair to expect prices to weaken later in 2023"
A brief excerpt:
Some interesting data on negative equity and limited equity.There is much more in the article. You can subscribe at https://calculatedrisk.substack.com/
• As of September, 383K (0.7% of) mortgage holders were underwater on their homes – less than half the share prior to the pandemic and in the early 2000s before the Global Financial Crisis
• Likewise, the number of borrowers in limited-equity positions remains historically low, with 1.9M (4.2% of) mortgage holders having less than 10% equity in their homes
• Austin – where home prices remain more than 14% off 2022 peaks – is in the worst position of all markets, with 2.1% of mortgage holders underwater, followed by Las Vegas (1.7%) and Phoenix (1.6%)
• San Jose – despite its home-price struggles last year – and Los Angeles have the lowest negative equity rates at 0.1%
• Overall, the weighted-average combined loan-to-value ratio for all mortgaged homes in the U.S. is 45%, among the strongest we’ve seen, dating back more than 20 years, outside of Feb.-Aug. 2022 at the peak of home prices
emphasis added

Housing November 6th Weekly Update: Inventory Still Increasing, Up 0.8% Week-over-week
by Calculated Risk on 11/06/2023 08:11:00 AM
Altos reports that active single-family inventory was up 0.8% week-over-week. This is the latest in the year that inventory was still increasing!
 Click on graph for larger image.
This inventory graph is courtesy of Altos Research.
As of November 3rd, inventory was at 567 thousand (7-day average), compared to 563 thousand the prior week.
Year-to-date, inventory is up 15.5%. And inventory is up 39.6% from the seasonal bottom 29 weeks ago.

The red line is for 2023. The black line is for 2019. Note that inventory is up from the record low for the same week in 2021, but below last year and still well below normal levels.
Inventory was down 1.5% compared to the same week in 2022 (last week it was down 2.7%), and down 37.1% compared to the same week in 2019 (last week down 39.4%).
In 2022, inventory peaked at the end of October (the latest in the year inventory had peaked until this year). I now expect inventory to be up YoY soon.
Inventory is now 4.4% above the same week in 2020 levels (dark blue line).
Mike Simonsen discusses this data regularly on Youtube.
Sunday, November 05, 2023
Monday: Senior Loan Officer Opinion Survey
by Calculated Risk on 11/05/2023 06:15:00 PM
Weekend:
• Schedule for Week of November 5, 2023
Monday:
• At 2:00 PM, Senior Loan Officer Opinion Survey on Bank Lending Practices (SLOOS) for October.
From CNBC: Pre-Market Data and Bloomberg futures S&P 500 futures are up 5 and DOW futures are up 40 (fair value).
Oil prices were down over the last week with WTI futures at $80.51 per barrel and Brent at $84.89 per barrel. A year ago, WTI was at $93, and Brent was at $100 - so WTI oil prices were down 13% year-over-year.
Here is a graph from Gasbuddy.com for nationwide gasoline prices. Nationally prices are at $3.37 per gallon. A year ago, prices were at $3.79 per gallon, so gasoline prices are down $0.42 year-over-year.
Hotels: Occupancy Rate Increased 0.7% Year-over-year
by Calculated Risk on 11/05/2023 08:21:00 AM
U.S. hotel performance decreased from the previous week but showed positive year-over-year comparisons, according to CoStar’s latest data through 28 October.The following graph shows the seasonal pattern for the hotel occupancy rate using the four-week average.
22-28 October 2023 (percentage change from comparable week in 2022):
• Occupancy: 66.0% (+0.7%)
• Average daily rate (ADR): US$160.89 (+3.9%)
• Revenue per available room (RevPAR): US$106.16 (+4.6%)
emphasis added
 Click on graph for larger image.
The red line is for 2023, black is 2020, blue is the median, and dashed light blue is for 2022. Dashed purple is for 2018, the record year for hotel occupancy.
The 4-week average of the occupancy rate is tracking close to last year, and above the median rate for the period 2000 through 2022 (Blue).
Note: Y-axis doesn't start at zero to better show the seasonal change.
The 4-week average of the occupancy rate will decline seasonally for the next couple of months.
Saturday, November 04, 2023
Real Estate Newsletter Articles this Week: National House Price Index Up 2.6% year-over-year in August
by Calculated Risk on 11/04/2023 02:11:00 PM
At the Calculated Risk Real Estate Newsletter this week:
• Case-Shiller: National House Price Index Up 2.6% year-over-year in August; New all-time High
• Inflation Adjusted House Prices 3.1% Below Peak
• Freddie Mac House Price Index Increased in September to New High; Up 5.2% Year-over-year
• Asking Rents Down 1.2% Year-over-year
• Lawler: Single-Family Rent Results Invitation Homes, and AMH (American Homes 4 Rent)
This is usually published 4 to 6 times a week and provides more in-depth analysis of the housing market.
You can subscribe at https://calculatedrisk.substack.com/
Schedule for Week of November 5, 2023
by Calculated Risk on 11/04/2023 08:11:00 AM
This will be a light week for economic data.
2:00 PM: Senior Loan Officer Opinion Survey on Bank Lending Practices (SLOOS) for October.
8:00 AM ET: Corelogic House Price index for September.
 8:30 AM: Trade Balance report for September from the Census Bureau. The consensus is for the deficit to be $60.3 billion in September, from $58.3 billion in August.
This graph shows the U.S. trade deficit, with and without petroleum, through the most recent report.
The blue line is the total deficit, and the black line is the petroleum deficit, and the red line is the trade deficit ex-petroleum products.
11:00 AM: NY Fed: Q3 Quarterly Report on Household Debt and Credit
7:00 AM ET: The Mortgage Bankers Association (MBA) will release the results for the mortgage purchase applications index.
8:30 AM: The initial weekly unemployment claims report will be released. The consensus is for 221 thousand initial claims, up from 217 thousand last week.
Veterans Day Holiday: Most banks will be closed in observance of Veterans Day. The stock market will be open.
10:00 AM: University of Michigan's Consumer sentiment index (Preliminary for November).


