 RSS Feed
 by Calculated Risk on 11/09/2023 03:07:00 PM
Thursday, November 09, 2023
Census: U.S. Population Projected to Begin Declining in Second Half of Century
I'll have much more on these projections - and the implications for housing - soon (I'm sure housing economist Tom Lawler will comment!)
From Census: U.S. Population Projected to Begin Declining in Second Half of Century
The U.S. population is projected to reach a high of nearly 370 million in 2080 before edging downward to 366 million in 2100. By 2100, the total U.S. resident population is only projected to increase 9.7% from 2022, according to the latest U.S. Census Bureau population projections released today. The projections provide possible scenarios of population change for the nation through the end of the century.
...
“In an ever-changing world, understanding population dynamics is crucial for shaping policies and planning resources,” stated Sandra Johnson, a demographer at the Census Bureau.
“The U.S. has experienced notable shifts in the components of population change over the last five years,” she explained. “Some of these, like the increases in mortality caused by the COVID-19 pandemic, are expected to be short-term while others, including the declines in fertility that have persisted for decades, are likely to continue into the future. Incorporating additional years of data on births, deaths and international migration into our projections process resulted in a slower pace of population growth through 2060 than was previously projected.”
Projections illustrate possible courses of population change based on assumptions about future births, deaths and net international migration. The 2023 projections include a main series (also known as the middle series) considered the most likely outcome of four assumptions, and three alternative immigration scenarios that show how the population might change under high, low and zero immigration assumptions.
 Click on graph for larger image.
This graph shows the projected US population for the four series.
From Census:
By 2100, the total population in the middle series is projected to reach 366 million compared to the projection for the high-immigration scenario, which puts the population at 435 million. The population for the middle series increases to a peak at 370 million in 2080 and then begins to decline, dropping to 366 million in 2100. The high-immigration scenario increases every year and is projected to reach 435 million by 2100.
The low-immigration scenario is projected to peak at around 346 million in 2043 and decline thereafter, dropping to 319 million in 2100.
Though largely illustrative, the zero-immigration scenario projects that population declines would start in 2024 in the complete absence of foreign-born immigration. The population in this scenario is projected to be 226 million in 2100, roughly 107 million lower than the 2022 estimate.
Hotels: Occupancy Rate Decreased 4.0% Year-over-year
by Calculated Risk on 11/09/2023 01:33:00 PM
U.S. hotel performance showed an expected decline from the previous week as well as mixed year-over-year comparisons, according to CoStar’s latest data through 4 November.The following graph shows the seasonal pattern for the hotel occupancy rate using the four-week average.
29 October through 4 November 2023 (percentage change from comparable week in 2022):
• Occupancy: 59.7% (-4.0%)
• Average daily rate (ADR): US$152.90 (+2.0%)
• Revenue per available room (RevPAR): US$91.23 (-2.1%)
The decrease in occupancy was anticipated with Halloween falling on Tuesday.
emphasis added
 Click on graph for larger image.
The red line is for 2023, black is 2020, blue is the median, and dashed light blue is for 2022. Dashed purple is for 2018, the record year for hotel occupancy.
The 4-week average of the occupancy rate is tracking close to last year, and above the median rate for the period 2000 through 2022 (Blue).
Note: Y-axis doesn't start at zero to better show the seasonal change.
The 4-week average of the occupancy rate will decline seasonally for the next couple of months.
Realtor.com Reports Weekly New Listings UP 0.6% YoY; Active Inventory Down Only 0.2% YoY
by Calculated Risk on 11/09/2023 09:35:00 AM
Realtor.com has monthly and weekly data on the existing home market. Here is their weekly report: Weekly Housing Trends View — Data Week Ending Nov 4, 2023
• Active inventory declined slightly, with for-sale homes lagging behind year ago levels by 0.2%. For 20 straight weeks, the number of homes available for sale has registered below that of the previous year, though by just a small margin this week.
• New listings–a measure of sellers putting homes up for sale–were up this week, by 0.6% from one year ago. Since mid-2022, new listings have registered lower than prior year levels, as the mortgage rate lock-in effect freezes homeowners with low-rate existing mortgages in place. Over the last two weeks, however, the trend has reversed as new listings during the week outpaced the same week in the previous year by 0.6%, smaller than the previous week’s spike. This week’s stabilization comes after a spike last week, falling more in line with the shrinking gap in new listings over the last few months. With the number of homes for sale already limited, a lack of growth in new listings is likely to continue to weigh on existing home sales in the months ahead.
 Here is a graph of the year-over-year change in inventory according to realtor.com.
 Inventory was down 0.2% year-over-year - this was the 20th consecutive week with a YoY decrease following 58 consecutive weeks with a YoY increase in inventory.
The YoY decline in inventory has generally been getting smaller recently and I expect inventory to be up YoY soon - but still historically very low.
New listings really collapsed a year ago, so the YoY comparison for new listings is easier now - and although new listings remain historically very low, new listings are now up YoY.
Weekly Initial Unemployment Claims Decrease to 217,000
by Calculated Risk on 11/09/2023 08:30:00 AM
The DOL reported:
In the week ending November 4, the advance figure for seasonally adjusted initial claims was 217,000, a decrease of 3,000 from the previous week's revised level. The previous week's level was revised up by 3,000 from 217,000 to 220,000. The 4-week moving average was 212,250, an increase of 1,500 from the previous week's revised average. The previous week's average was revised up by 750 from 210,000 to 210,750.The following graph shows the 4-week moving average of weekly claims since 1971.
emphasis added
 Click on graph for larger image.
The dashed line on the graph is the current 4-week average. The four-week average of weekly unemployment claims increased to 212,250.
The previous week was revised up.
Weekly claims were sligthly lower than the consensus forecast.
Wednesday, November 08, 2023
Thursday: Unemployment Claims
by Calculated Risk on 11/08/2023 07:40:00 PM
 Note: Mortgage rates are from MortgageNewsDaily.com and are for top tier scenarios.
Thursday:
• At 8:30 AM ET, The initial weekly unemployment claims report will be released. The consensus is for 221 thousand initial claims, up from 217 thousand last week.
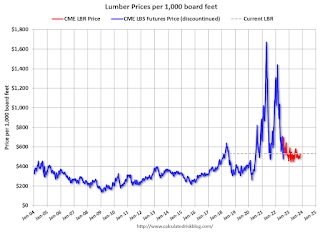
Update: Lumber Prices Down Slightly YoY
by Calculated Risk on 11/08/2023 02:25:00 PM
Here is another monthly update on lumber prices.
Unfortunately, this impacts long term price comparisons since the new contract was priced about 24% higher than the old random length contract for the period both contracts were available.
This graph shows CME random length framing futures through last August (blue), and the new physically-delivered Lumber Futures (LBR) contract starting in August 2022 (Red).
 Click on graph for larger image.
We didn't see a significant runup in prices this Spring due to the housing slowdown.
This graph shows CME random length framing futures through last August (blue), and the new physically-delivered Lumber Futures (LBR) contract starting in August 2022 (Red).
LBR is currently at $530.50 per 1000 board feet, down 1% from $535.00 a year ago.
 Click on graph for larger image.
There is somewhat of a seasonal demand for lumber, and lumber prices usually peak in April or May.
We didn't see a significant runup in prices this Spring due to the housing slowdown.
Housing: Inventory will Tell the Tale
by Calculated Risk on 11/08/2023 09:42:00 AM
Today, in the Calculated Risk Real Estate Newsletter: Inventory will Tell the Tale
A brief excerpt:
Two years ago, in November 2021, I wrote Inventory will Tell the Tale and recounted how changes in housing inventory had helped me forecast the housing market at several key points. Here is an update to that post with a few additional comments.There is much more in the article. You can subscribe at https://calculatedrisk.substack.com/
...
Starting in January 2005, I was very bearish on housing, but I wasn’t sure when the market would turn. Speculative bubbles can go on and on. However, the increase in inventory in late 2005 (see red arrow on graph below) helped me call the top for house prices in 2006.
Several years later, in early 2012, when many people were still bearish on housing, the plunge in inventory in 2011 (blue arrow on graph below) helped me call the bottom for house prices in early 2012 (see The Housing Bottom is Here).
...
With higher mortgage rates and increasing inventory, a key question right now is “Will prices decline over the winter?”. I’ll update some price projections soon.
But I believe one thing is certain: inventory will tell the tale!

MBA: Mortgage Applications Increased in Weekly Survey
by Calculated Risk on 11/08/2023 07:00:00 AM
From the MBA: Mortgage Applications Increase in Latest MBA Weekly Survey
Mortgage applications increased 2.5 percent from one week earlier, according to data from the Mortgage Bankers Association’s (MBA) Weekly Mortgage Applications Survey for the week ending November 3, 2023.
The Market Composite Index, a measure of mortgage loan application volume, increased 2.5 percent on a seasonally adjusted basis from one week earlier. On an unadjusted basis, the Index increased 1 percent compared with the previous week. The Refinance Index increased 2 percent from the previous week and was 7 percent lower than the same week one year ago. The seasonally adjusted Purchase Index increased 3 percent from one week earlier. The unadjusted Purchase Index increased 1 percent compared with the previous week and was 20 percent lower than the same week one year ago.
“The 30-year fixed mortgage rate dropped by 25 basis points to 7.61 percent, the largest single week decline since July 2022,” said Joel Kan, MBA’s Vice President and Deputy Chief Economist. “Last week’s decrease in rates was driven by the U.S. Treasury’s issuance update, the Fed striking a dovish tone in the November FOMC statement, and data indicating a slower job market. Applications for both purchase and refinance loans were up over the week but remained at low levels. The purchase index is still more than 20 percent behind last year’s pace, as many homebuyers remain on the sidelines until more for-sale inventory becomes available.”
...
The average contract interest rate for 30-year fixed-rate mortgages with conforming loan balances ($726,200 or less) decreased to 7.61 percent from 7.86 percent, with points decreasing to 0.69 from 0.73 (including the origination fee) for 80 percent loan-to-value ratio (LTV) loans.
emphasis added
 Click on graph for larger image.
The first graph shows the MBA mortgage purchase index.
According to the MBA, purchase activity is down 20% year-over-year unadjusted.
Red is a four-week average (blue is weekly). The previous week the purchase index was at the lowest level since 1995.

The second graph shows the refinance index since 1990.
With higher mortgage rates, the refinance index declined sharply in 2022 - and has mostly flat lined at a low level since then.
Tuesday, November 07, 2023
Wednesday: Mortgage Applications
by Calculated Risk on 11/07/2023 09:00:00 PM
 Note: Mortgage rates are from MortgageNewsDaily.com and are for top tier scenarios.
Wednesday:
• At 7:00 AM ET, The Mortgage Bankers Association (MBA) will release the results for the mortgage purchase applications index.
Leading Index for Commercial Real Estate Increased in October, Down 8% YoY
by Calculated Risk on 11/07/2023 04:59:00 PM
From Dodge Data Analytics: Dodge Momentum Index Inches Up 1% in October
The Dodge Momentum Index (DMI), issued by Dodge Construction Network, increased 1% in October to 181.7 (2000=100) from the revised September reading of 180.3. Over the month, the commercial component of the DMI rose 2.0%, while the institutional component retreated 1.4%.
“Heightened momentum in warehouse planning activity supported the commercial side of the Index this month, while muted education planning activity slowed the institutional portion,” stated Sarah Martin, associate director of forecasting for Dodge Construction Network. “Overall levels of planning activity remain robust and will support construction spending over the next 12 to 18 months.”
Improvements in warehouse planning helped support commercial growth, but despite strong progress in September, education and healthcare activity slowed down this month. Year over year, the DMI was 8% lower than in October 2022. The commercial segment was down 14%, while the institutional segment was up 7%.
...
The DMI is a monthly measure of the initial report for nonresidential building projects in planning, shown to lead construction spending for nonresidential buildings by a full year.
emphasis added
 Click on graph for larger image.
This graph shows the Dodge Momentum Index since 2002. The index was at 181.7 in October, up from 180.3 the previous month.
According to Dodge, this index leads "construction spending for nonresidential buildings by a full year". This index suggests some slowdown towards the end of 2023 and in 2024.
Commercial construction is typically a lagging economic indicator.


