by Calculated Risk on 11/11/2023 02:11:00 PM
Saturday, November 11, 2023
Real Estate Newsletter Articles this Week: Inventory will Tell the Tale
At the Calculated Risk Real Estate Newsletter this week:
• 2nd Look at Local Housing Markets in October
• Part 1: Current State of the Housing Market; Overview for mid-November
• Inventory will Tell the Tale
• 1st Look at Local Housing Markets in October
• ICE (Black Knight) Mortgage Monitor: "It’s fair to expect prices to weaken later in 2023
This is usually published 4 to 6 times a week and provides more in-depth analysis of the housing market.
You can subscribe at https://calculatedrisk.substack.com/
Schedule for Week of November 12, 2023
by Calculated Risk on 11/11/2023 08:11:00 AM
The key economic reports this week are October CPI, Retail Sales, and Housing Starts.
For manufacturing, October industrial production, and the November New York, Philly and Kansas City Fed surveys, will be released this week.
No major economic releases scheduled.
6:00 AM: NFIB Small Business Optimism Index for October.
8:30 AM: The Consumer Price Index for October from the BLS. The consensus is for a 0.1% increase in CPI, and a 0.3% increase in core CPI. The consensus is for CPI to be up 3.3% year-over-year and core CPI to be up 4.1% YoY.
7:00 AM ET: The Mortgage Bankers Association (MBA) will release the results for the mortgage purchase applications index.
 8:30 AM ET: Retail sales for October will be released.
The consensus is for a 0.3% decrease in retail sales.
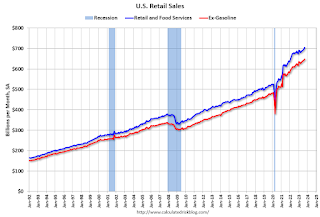
This graph shows retail sales since 1992. This is monthly retail sales and food service, seasonally adjusted (total and ex-gasoline).
8:30 AM: The Producer Price Index for October from the BLS. The consensus is for a 0.1% increase in PPI, and a 0.3% increase in core PPI.
8:30 AM: The New York Fed Empire State manufacturing survey for November. The consensus is for a reading of -2.6, up from -4.6.
During the day: The AIA's Architecture Billings Index for October (a leading indicator for commercial real estate).
8:30 AM: The initial weekly unemployment claims report will be released. The consensus is for 222 thousand initial claims, up from 217 thousand last week.
8:30 AM: the Philly Fed manufacturing survey for November. The consensus is for a reading of -11.0, down from -9.0.
 9:15 AM: The Fed will release Industrial Production and Capacity Utilization for October.
This graph shows industrial production since 1967.
The consensus is for a 0.4% decrease in Industrial Production, and for Capacity Utilization to decrease to 79.4%.
10:00 AM: The November NAHB homebuilder survey. The consensus is for a reading of 40, unchanged from 40. Any number below 50 indicates that more builders view sales conditions as poor than good.
11:00 AM: the Kansas City Fed manufacturing survey for November.
 8:30 AM: Housing Starts for October.
 This graph shows single and total housing starts since 1968.
The consensus is for 1.345 million SAAR, down from 1.358 million SAAR.
10:00 AM: State Employment and Unemployment (Monthly) for October 2023
Friday, November 10, 2023
Nov 10th COVID Update: Deaths and Hospitalizations Decreased
by Calculated Risk on 11/10/2023 07:37:00 PM

| COVID Metrics | ||||
|---|---|---|---|---|
| Now | Week Ago | Goal | ||
| Hospitalized2 | 12,526 | 13,158 | ≤3,0001 | |
| Deaths per Week2 | 1,143 | 1,262 | ≤3501 | |
| 1my goals to stop weekly posts, 2Weekly for Currently Hospitalized, and Deaths 🚩 Increasing number weekly for Hospitalized and Deaths ✅ Goal met. | ||||
 Click on graph for larger image.
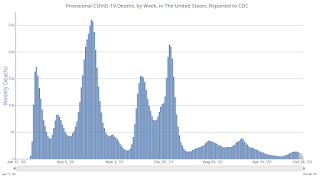
This graph shows the weekly (columns) number of deaths reported.
MBA: Mortgage Delinquencies Increase in the Third Quarter of 2023
by Calculated Risk on 11/10/2023 03:39:00 PM
From the MBA: Mortgage Delinquencies Increase in the Third Quarter of 2023
The delinquency rate for mortgage loans on one-to-four-unit residential properties increased to a seasonally adjusted rate of 3.62 percent of all loans outstanding at the end of the third quarter of 2023, according to the Mortgage Bankers Association’s (MBA) National Delinquency Survey.
The delinquency rate was up 25 basis points from the second quarter of 2023 and up 17 basis points from one year ago. The percentage of loans on which foreclosure actions were started in the third quarter rose by 1 basis point to 0.14 percent.
“The national mortgage delinquency rate increased in the third quarter from the record survey low reached in the second quarter of this year, with an uptick in delinquencies across all loan types – conventional, FHA, and VA,” said Marina Walsh, CMB, MBA’s Vice President of Industry Analysis. “The increase was driven entirely by a rise in earliest-stage delinquencies – those 30-days and 60-days past due. Later-stage delinquencies – those 90 days or more past due – declined to the lowest level since the first quarter of 2020.”
Added Walsh, “The decline in later-stage delinquencies, along with a foreclosure starts rate of 0.14 percent – which is well below the historical quarterly average of 0.40 percent – suggest that distressed homeowners may be utilizing available loss mitigation options that prevent a foreclosure start. Additionally, accumulated home equity may also be enabling some homeowners to sell their homes well before foreclosure becomes a possibility.”
emphasis added
 Click on graph for larger image.
This graph shows the percent of loans delinquent by days past due. Overall delinquencies increased in Q3.
Compared to last quarter, the seasonally adjusted mortgage delinquency rate increased for all loans outstanding. By stage, the 30-day delinquency rate increased 28 basis points to 2.03 percent, the 60-day delinquency rate increased 7 basis points to 0.62 percent, and the 90-day delinquency bucket decreased 9 basis points to 0.98 percent.The sharp increase in 2020 in the 90-day bucket was due to loans in forbearance (included as delinquent, but not reported to the credit bureaus).
...
The delinquency rate includes loans that are at least one payment past due but does not include loans in the process of foreclosure. The percentage of loans in the foreclosure process at the end of the third quarter was 0.49 percent, down 4 basis points from the second quarter of 2023 and down 7 basis points lower than one year ago. This is the lowest foreclosure inventory rate since fourth-quarter 2021.
The percent of loans in the foreclosure process decreased year-over-year in Q3 even with the end of the foreclosure moratoriums and are historically low.
2nd Look at Local Housing Markets in October
by Calculated Risk on 11/10/2023 11:21:00 AM
Today, in the Calculated Risk Real Estate Newsletter: 2nd Look at Local Housing Markets in October
A brief excerpt:
NOTE: Starting next month, I’ll add some comparisons to 2019 (pre-pandemic)!There is much more in the article. You can subscribe at https://calculatedrisk.substack.com/
This is the second look at several early reporting local markets in October. I’m tracking about 40 local housing markets in the US. Some of the 40 markets are states, and some are metropolitan areas. I’ll update these tables throughout the month as additional data is released.
Closed sales in October were mostly for contracts signed in August and September. Since 30-year fixed mortgage rates were in the 7.1% in August and 7.2% in September, compared to the high-5% range the previous year, closed sales were down year-over-year in October.
...
In October, sales in these markets were down 10.3%. In September, these same markets were down 18.8% YoY Not Seasonally Adjusted (NSA).
This is a much smaller YoY decline NSA than in September for these early reporting markets. However, this is where seasonal adjustments make a difference.
There was one more working day in October 2023 compared to October 2022, the opposite of September when there was one fewer working day in 2023 compared to 2022. So, for October, the seasonally adjusted decline will be larger than the NSA decline.
...
This early data suggests the October existing home sales report will show another significant YoY decline, perhaps to just above 4 million SAAR (early guess of Seasonally Adjusted Annual Rate), and above the cycle low of 3.96 million SAAR last month. This will be the 26th consecutive month with a YoY decline in sales.
...
Many more local markets to come!
Q4 GDP Tracking: Starting Close to 2%
by Calculated Risk on 11/10/2023 08:40:00 AM
From BofA:
Overall, data since our last weekly publication pushed up our 3Q US GDP tracking estimate from 5.1% q/q saar to 5.2% q/q saar. [W]e will start our 4Q US GDP tracker with the retail sales print [Nov 10th]From Goldman:
emphasis added
We boosted our past-quarter GDP tracking estimate for Q3 to +5.2% and left our Q4 GDP tracking estimate unchanged at +1.6%. [Nov 8th estimate]And from the Altanta Fed: GDPNow
The GDPNow model estimate for real GDP growth (seasonally adjusted annual rate) in the fourth quarter of 2023 is 2.1 percent on November 8, unchanged from November 7 after rounding. [Nov 8th estimate]
Thursday, November 09, 2023
Friday: Veterans Day
by Calculated Risk on 11/09/2023 08:10:00 PM

Friday:
• Veterans Day Holiday: Most banks will be closed in observance of Veterans Day. The stock market will be open.
• At 10:00 AM ET, University of Michigan's Consumer sentiment index (Preliminary for November).
Part 1: Current State of the Housing Market; Overview for mid-November
by Calculated Risk on 11/09/2023 03:39:00 PM
Today, in the Calculated Risk Real Estate Newsletter: Part 1: Current State of the Housing Market; Overview for mid-November
A brief excerpt:
The NAR reported sales were at a “seasonally adjusted annual rate of 3.96 million in September. Year-over-year, sales dropped 15.4% (down from 4.68 million in September 2022).” This was in line with the local markets I tracked for September.There is much more in the article. You can subscribe at https://calculatedrisk.substack.com/
This was a new cycle low for existing home sales.
Usually, house prices bottom after sales bottom, so a new cycle low for sales suggests likely further weakness for house prices in coming months. I’ll have more on this pattern.
Census: U.S. Population Projected to Begin Declining in Second Half of Century
by Calculated Risk on 11/09/2023 03:07:00 PM
I'll have much more on these projections - and the implications for housing - soon (I'm sure housing economist Tom Lawler will comment!)
From Census: U.S. Population Projected to Begin Declining in Second Half of Century
The U.S. population is projected to reach a high of nearly 370 million in 2080 before edging downward to 366 million in 2100. By 2100, the total U.S. resident population is only projected to increase 9.7% from 2022, according to the latest U.S. Census Bureau population projections released today. The projections provide possible scenarios of population change for the nation through the end of the century.
...
“In an ever-changing world, understanding population dynamics is crucial for shaping policies and planning resources,” stated Sandra Johnson, a demographer at the Census Bureau.
“The U.S. has experienced notable shifts in the components of population change over the last five years,” she explained. “Some of these, like the increases in mortality caused by the COVID-19 pandemic, are expected to be short-term while others, including the declines in fertility that have persisted for decades, are likely to continue into the future. Incorporating additional years of data on births, deaths and international migration into our projections process resulted in a slower pace of population growth through 2060 than was previously projected.”
Projections illustrate possible courses of population change based on assumptions about future births, deaths and net international migration. The 2023 projections include a main series (also known as the middle series) considered the most likely outcome of four assumptions, and three alternative immigration scenarios that show how the population might change under high, low and zero immigration assumptions.
 Click on graph for larger image.
This graph shows the projected US population for the four series.
From Census:
By 2100, the total population in the middle series is projected to reach 366 million compared to the projection for the high-immigration scenario, which puts the population at 435 million. The population for the middle series increases to a peak at 370 million in 2080 and then begins to decline, dropping to 366 million in 2100. The high-immigration scenario increases every year and is projected to reach 435 million by 2100.
The low-immigration scenario is projected to peak at around 346 million in 2043 and decline thereafter, dropping to 319 million in 2100.
Though largely illustrative, the zero-immigration scenario projects that population declines would start in 2024 in the complete absence of foreign-born immigration. The population in this scenario is projected to be 226 million in 2100, roughly 107 million lower than the 2022 estimate.
Hotels: Occupancy Rate Decreased 4.0% Year-over-year
by Calculated Risk on 11/09/2023 01:33:00 PM
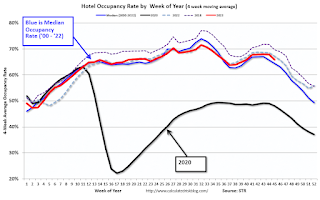
U.S. hotel performance showed an expected decline from the previous week as well as mixed year-over-year comparisons, according to CoStar’s latest data through 4 November.The following graph shows the seasonal pattern for the hotel occupancy rate using the four-week average.
29 October through 4 November 2023 (percentage change from comparable week in 2022):
• Occupancy: 59.7% (-4.0%)
• Average daily rate (ADR): US$152.90 (+2.0%)
• Revenue per available room (RevPAR): US$91.23 (-2.1%)
The decrease in occupancy was anticipated with Halloween falling on Tuesday.
emphasis added
 Click on graph for larger image.
The red line is for 2023, black is 2020, blue is the median, and dashed light blue is for 2022. Dashed purple is for 2018, the record year for hotel occupancy.


