by Calculated Risk on 11/14/2023 02:34:00 PM
Tuesday, November 14, 2023
Lawler: New Census Long-Term Population Projections Are MASSIVELY Lower Than Previous Projections
Today, in the Calculated Risk Real Estate Newsletter: Lawler: New Census Long-Term Population Projections Are MASSIVELY Lower Than Previous Projections
A brief excerpt:
From housing economist Tom Lawler:There is much more in the article. You can subscribe at https://calculatedrisk.substack.com/
Last Friday Census released new long-term projections of the US resident population, this time going out to 2100. The last time Census released long-term population projections was in 2017 (going out to 2060), and the 2023 projections for the “middle” scenario are massively lower than the 2017 projections.
Here is a chart showing the “middle-case” projections for the US resident population for the 2017 release compared to the 2023 release. (Note: Census has not released updated population estimates for 2011 through 2019 that reflect Census 2020 results, but I have estimated what 2016 to 2019 would look like based on updated net international migration estimates for 2010 through 2019.)
...
I have been looking into these projections and have found some “issues” for the projections over the next few years, and I’ll be rewriting more about this topic soon. However, for those analysts who have kept using the 2017 population projections for analysis purposes even though it was obvious they were woefully out of date, these latest population projections have surely left them “dazed and confused.”
Cleveland Fed: Median CPI increased 0.3% and Trimmed-mean CPI increased 0.2% in October
by Calculated Risk on 11/14/2023 11:25:00 AM
According to the Federal Reserve Bank of Cleveland, the median Consumer Price Index rose 0.3% in October. The 16% trimmed-mean Consumer Price Index increased 0.2% in October. "The median CPI and 16% trimmed-mean CPI are measures of core inflation calculated by the Federal Reserve Bank of Cleveland based on data released in the Bureau of Labor Statistics’ (BLS) monthly CPI report".
 Click on graph for larger image.
This graph shows the year-over-year change for these four key measures of inflation.
Note: The Cleveland Fed released the median CPI details. "Motor fuel" decreased at a 45% annualized rate in October. Rent and Owner's equivalent rent are still high, but decreasing.
YoY Measures of Inflation: Services, Goods and Shelter
by Calculated Risk on 11/14/2023 09:21:00 AM
Here are a few measures of inflation:
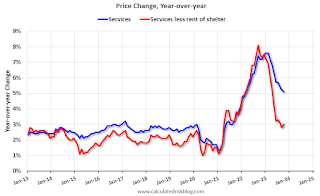
The first graph is the one Fed Chair Powell had mentioned earlier when services less rent of shelter was up 7.6% year-over-year. This has fallen sharply and is now up 3.0% YoY.

This graph shows the YoY price change for Services and Services less rent of shelter through September 2023.
Services less rent of shelter was up 3.0% YoY in October, up from 2.8% YoY in September.
 The second graph shows that goods prices started to increase year-over-year (YoY) in 2020 and accelerated in 2021 due to both strong demand and supply chain disruptions.
Commodities less food and energy commodities were unchanged YoY in October, unchanged from 0.0% YoY in September.
 Here is a graph of the year-over-year change in shelter from the CPI report (through October) and housing from the PCE report (through September 2023)
Shelter was up 6.7% year-over-year in October, down from 7.1% in September. Housing (PCE) was up 7.2% YoY in September, down from 7.4% in August.
The BLS noted this morning: "The index for shelter continued to rise in October"
Core CPI ex-shelter was up 2.0% YoY in October, up from 1.9% in September.
BLS: CPI Unchanged in October; Core CPI increased 0.2%
by Calculated Risk on 11/14/2023 08:32:00 AM
The Consumer Price Index for All Urban Consumers (CPI-U) was unchanged in October on a seasonally adjusted basis, after increasing 0.4 percent in September, the U.S. Bureau of Labor Statistics reported today. Over the last 12 months, the all items index increased 3.2 percent before seasonal adjustment.CPI and core CPI were lower than expectated. I'll post a graph later today after the Cleveland Fed releases the median and trimmed-mean CPI.
The index for shelter continued to rise in October, offsetting a decline in the gasoline index and resulting in the seasonally adjusted index being unchanged over the month. The energy index fell 2.5 percent over the month as a 5.0-percent decline in the gasoline index more than offset increases in other energy component indexes. The food index increased 0.3 percent in October, after rising 0.2 percent in September. The index for food at home increased 0.3 percent over the month while the index for food away from home rose 0.4 percent.
The index for all items less food and energy rose 0.2 percent in October, after rising 0.3 percent in September. Indexes which increased in October include rent, owners' equivalent rent, motor vehicle insurance, medical care, recreation, and personal care. The indexes for lodging away from home, used cars and trucks, communication, and airline fares were among those that decreased over the month.
The all items index rose 3.2 percent for the 12 months ending October, a smaller increase than the 3.7-percent increase for the 12 months ending September. The all items less food and energy index rose 4.0 percent over the last 12 months, its smallest 12-month change since the period ending in September 2021. The energy index decreased 4.5 percent for the 12 months ending October, and the food index increased 3.3 percent over the last year.
emphasis added
Monday, November 13, 2023
Tuesday: CPI
by Calculated Risk on 11/13/2023 07:31:00 PM

Mortgage rates began the day at the highest levels in nearly 2 weeks. The underlying bond market had been losing ground steadily since last Thursday and there was some follow-through to that negative momentum early today. Weaker bonds = higher rates, all other things being equal.Tuesday:
But bonds recovered from 10am through the end of the day and the specific bonds that underlie mortgage rates did even better than their Treasury benchmarks.[30 year fixed 7.58%]
emphasis added
• At 6:00 AM ET, NFIB Small Business Optimism Index for October.
• At 8:30 AM, The Consumer Price Index for October from the BLS. The consensus is for a 0.1% increase in CPI, and a 0.3% increase in core CPI. The consensus is for CPI to be up 3.3% year-over-year and core CPI to be up 4.1% YoY.
A Few Comments on a Possible Government Shutdown
by Calculated Risk on 11/13/2023 01:26:00 PM
First, shutdowns are expensive, and many government employees continue to work (like the military), but don't get paid.
For housing, depending on the length of the shutdown, there might be an impact on existing home closings in November. If the shutdown lasts through the end of the month, I'd expect some decline in seasonally adjusted sales in November. If the shutdown only lasts a week or so, there would probably be little impact. Some issues could be Tax transcripts, Flood Certs, and SS# Authorization.
Part 2: Current State of the Housing Market; Overview for mid-November
by Calculated Risk on 11/13/2023 10:17:00 AM
Today, in the Calculated Risk Real Estate Newsletter: Part 2: Current State of the Housing Market; Overview for mid-November
A brief excerpt:
Last week, in Part 1: Current State of the Housing Market; Overview for mid-November I reviewed home inventory and sales.There is much more in the article. You can subscribe at https://calculatedrisk.substack.com/
...
Most measures of house prices have shown an increase in prices over the last several months, and a key question I discussed in July is Will house prices decline further later this year? I will revisit this question soon.
Other measures of house prices suggest prices will be up further YoY in the September Case-Shiller index. The NAR reported median prices were up 2.8% YoY in September, down from 3.9% YoY in August. ICE / Black Knight reported prices were up 4.3% YoY in September, up from 3.7% YoY in August to new all-time highs, and Freddie Mac reported house prices were up 5.2% YoY in September, up from 4.3% YoY in August - and also to new all-time highs.
Here is a comparison of year-over-year change in the FMHPI, median house prices from the NAR, and the Case-Shiller National index.
The FMHPI and the NAR median prices appear to be leading indicators for Case-Shiller. Based on recent monthly data, and the FMHPI, the YoY change in the Case-Shiller index will increase further in the report for September.
Housing November 13th Weekly Update: Inventory Mostly Flat Week-over-week
by Calculated Risk on 11/13/2023 08:19:00 AM
 Click on graph for larger image.
This inventory graph is courtesy of Altos Research.

Sunday, November 12, 2023
Sunday Night Futures
by Calculated Risk on 11/12/2023 06:43:00 PM
Weekend:
• Schedule for Week of November 12, 2023
Monday:
• No major economic releases scheduled.
From CNBC: Pre-Market Data and Bloomberg futures S&P 500 futures are down 5 and DOW futures are down 44 (fair value).
Oil prices were down over the last week with WTI futures at $77.03 per barrel and Brent at $81.28 per barrel. A year ago, WTI was at $89, and Brent was at $96 - so WTI oil prices were down 13% year-over-year.
Here is a graph from Gasbuddy.com for nationwide gasoline prices. Nationally prices are at $3.33 per gallon. A year ago, prices were at $3.78 per gallon, so gasoline prices are down $0.45 year-over-year.
When will the Fed Cut Rates?
by Calculated Risk on 11/12/2023 01:29:00 PM
If we look at the "dot plot" from the September FOMC projections, the median projection is for the Fed Funds rate to decline to 5.125% in Q4 2024 (from the current 5.25% to 5.5% range). That is one 25bp rate cut in 2024.
Goldman Sachs economists are projecting the first rate cut in Q4 2024:
We continue to expect that rates cuts will start in 2024Q4 and proceed at a pace of 25bp per quarterBofA economists are still projecting one more rate hike, and then three 25bp cuts in 2024 starting in Q2 2024.
Market participants are pricing in the first rate cut at the June 2024 FOMC meeting, followed by 2 more 25bp cuts in 2024 lowering the Fed Funds rate to 4.50% to 4.75% by December 2024.


