by Calculated Risk on 11/15/2023 02:48:00 PM
Wednesday, November 15, 2023
3rd Look at Local Housing Markets in October
Today, in the Calculated Risk Real Estate Newsletter: 3rd Look at Local Housing Markets in October
A brief excerpt:
NOTE: Starting next month, I’ll add some comparisons to 2019 (pre-pandemic)!There is much more in the article. You can subscribe at https://calculatedrisk.substack.com/
This is the third look at several early reporting local markets in October. I’m tracking about 40 local housing markets in the US. Some of the 40 markets are states, and some are metropolitan areas. I’ll update these tables throughout the month as additional data is released.
Closed sales in October were mostly for contracts signed in August and September. Since 30-year fixed mortgage rates were in the 7.1% in August and 7.2% in September, compared to the high-5% range the previous year, closed sales were down year-over-year in October.
...
In October, sales in these markets were down 9.5%. In September, these same markets were down 15.3% YoY Not Seasonally Adjusted (NSA).
This is a smaller YoY decline NSA than in September for these markets. However, this is where seasonal adjustments make a difference.
There was one more working day in October 2023 compared to October 2022, the opposite of September when there was one fewer working day in 2023 compared to 2022. So, for October, the seasonally adjusted decline will be larger than the NSA decline.
...
The data so far suggests the October existing home sales report will show another significant YoY decline, perhaps close to 4 million SAAR (early guess of Seasonally Adjusted Annual Rate), and maybe slightly above the cycle low of 3.96 million SAAR last month. This will be the 26th consecutive month with a YoY decline in sales.
...
More local markets to come!
AIA: "Continuing Decline in Architecture Billings"; Multi-family Billings Decline for 15th Consecutive Month
by Calculated Risk on 11/15/2023 10:23:00 AM
Note: This index is a leading indicator primarily for new Commercial Real Estate (CRE) investment.
From the AIA: Continuing Decline in Architecture Billings, AIA/Deltek Architecture Billings Index Reports
The AIA/Deltek Architecture Billings Index (ABI) reports that business conditions at architecture firms continued to soften in October. For the third consecutive month, the ABI score was under 50, indicating that a significant share of firms is seeing a decline in billings.
“This report indicates not only a decrease in billings at firms, but also a reduction in the number of clients exploring and committing to new projects, which could potentially impact future billings. The soft conditions were evident across the entire country as well as across all major nonresidential building sectors,” said Kermit Baker, PhD, AIA Chief Economist.
The score of 44.3 for October dipped slightly below the score of 44.8 in September. Billings were universally soft across the entire country in October, with firms located in the West and Northeast continuing to report the softest conditions overall for the second month in a row.
...
• Regional averages: Northeast (42.1); South (48.5); Midwest (48.9); West (40.0)
• Sector index breakdown: commercial/industrial (43.7); institutional (49.1); mixed practice (firms that do not have at least half of their billings in any one other category) (44.0); multifamily residential (40.1)
emphasis added
 Click on graph for larger image.
This graph shows the Architecture Billings Index since 1996. The index was at 44.3 in October, down from 44.8 in September. Anything below 50 indicates a decrease in demand for architects' services.
Note: This includes commercial and industrial facilities like hotels and office buildings, multi-family residential, as well as schools, hospitals and other institutions.
This index usually leads CRE investment by 9 to 12 months, so this index suggests a slowdown in CRE investment in 2024.
Retail Sales Decreased 0.1% in October
by Calculated Risk on 11/15/2023 08:30:00 AM
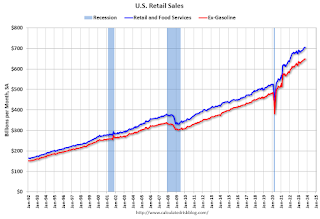
On a monthly basis, retail sales were down 0.1% from September to October (seasonally adjusted), and sales were up 2.5 percent from October 2022.
From the Census Bureau report:
Advance estimates of U.S. retail and food services sales for October 2023, adjusted for seasonal variation and holiday and trading-day differences, but not for price changes, were $705.0 billion, down 0.1 percent from the previous month, and up 2.5 percent above October 2022. ... The August 2023 to September 2023 percent change was revised from up 0.7 percent to up 0.9 percent.
emphasis added
 Click on graph for larger image.
This graph shows retail sales since 1992. This is monthly retail sales and food service, seasonally adjusted (total and ex-gasoline).
Retail sales ex-gasoline was down 0.1% in October.
The second graph shows the year-over-year change in retail sales and food service (ex-gasoline) since 1993.
Retail and Food service sales, ex-gasoline, increased by 3.5% on a YoY basis.
 The decrease in sales in October was above expectations, and sales in August and September were revised up, combined.
MBA: Mortgage Applications Increased in Weekly Survey
by Calculated Risk on 11/15/2023 07:00:00 AM
From the MBA: Mortgage Applications Increase in Latest MBA Weekly Survey
Mortgage applications increased 2.8 percent from one week earlier, according to data from the Mortgage Bankers Association’s (MBA) Weekly Mortgage Applications Survey for the week ending November 10, 2023.
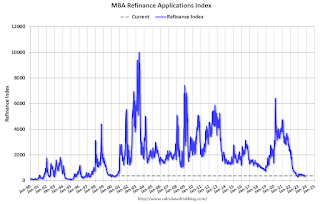
The Market Composite Index, a measure of mortgage loan application volume, increased 2.8 percent on a seasonally adjusted basis from one week earlier. On an unadjusted basis, the Index increased 0.4 percent compared with the previous week. The Refinance Index increased 2 percent from the previous week and was 7 percent higher than the same week one year ago. The seasonally adjusted Purchase Index increased 3 percent from one week earlier. The unadjusted Purchase Index decreased 0.3 percent compared with the previous week and was 12 percent lower than the same week one year ago.
“Although Treasury rates dipped midweek, mortgage rates were little changed on average through the week. The 30-year fixed mortgage rate remained at 7.61 percent, about 30 basis points lower than three weeks ago,” said Joel Kan, MBA’s Vice President and Deputy Chief Economist. “Both purchase and refinance applications increased to the highest weekly pace in five weeks but remain at very low levels. Despite the recent downward trend, mortgage rates at current levels are still challenging for many prospective homebuyers and current homeowners.”
...
The average contract interest rate for 30-year fixed-rate mortgages with conforming loan balances ($726,200 or less) remained unchanged at 7.61 percent, with points decreasing to 0.67 from 0.69 (including the origination fee) for 80 percent loan-to-value ratio (LTV) loans.
emphasis added
 Click on graph for larger image.
The first graph shows the MBA mortgage purchase index.
According to the MBA, purchase activity is down 12% year-over-year unadjusted.

Tuesday, November 14, 2023
Wednesday: Retail Sales, PPI, NY Fed Mfg
by Calculated Risk on 11/14/2023 07:59:00 PM

Wednesday:
• At 7:00 AM ET, The Mortgage Bankers Association (MBA) will release the results for the mortgage purchase applications index.
• At 8:30 AM, Retail sales for October will be released. The consensus is for a 0.3% decrease in retail sales.
• Also at 8:30 AM, The Producer Price Index for October from the BLS. The consensus is for a 0.1% increase in PPI, and a 0.3% increase in core PPI.
• Also at 8:30 AM, The New York Fed Empire State manufacturing survey for November. The consensus is for a reading of -2.6, up from -4.6.
• During the day, The AIA's Architecture Billings Index for October (a leading indicator for commercial real estate).
Lawler: New Census Long-Term Population Projections Are MASSIVELY Lower Than Previous Projections
by Calculated Risk on 11/14/2023 02:34:00 PM
Today, in the Calculated Risk Real Estate Newsletter: Lawler: New Census Long-Term Population Projections Are MASSIVELY Lower Than Previous Projections
A brief excerpt:
From housing economist Tom Lawler:There is much more in the article. You can subscribe at https://calculatedrisk.substack.com/
Last Friday Census released new long-term projections of the US resident population, this time going out to 2100. The last time Census released long-term population projections was in 2017 (going out to 2060), and the 2023 projections for the “middle” scenario are massively lower than the 2017 projections.
Here is a chart showing the “middle-case” projections for the US resident population for the 2017 release compared to the 2023 release. (Note: Census has not released updated population estimates for 2011 through 2019 that reflect Census 2020 results, but I have estimated what 2016 to 2019 would look like based on updated net international migration estimates for 2010 through 2019.)
...
I have been looking into these projections and have found some “issues” for the projections over the next few years, and I’ll be rewriting more about this topic soon. However, for those analysts who have kept using the 2017 population projections for analysis purposes even though it was obvious they were woefully out of date, these latest population projections have surely left them “dazed and confused.”
Cleveland Fed: Median CPI increased 0.3% and Trimmed-mean CPI increased 0.2% in October
by Calculated Risk on 11/14/2023 11:25:00 AM
According to the Federal Reserve Bank of Cleveland, the median Consumer Price Index rose 0.3% in October. The 16% trimmed-mean Consumer Price Index increased 0.2% in October. "The median CPI and 16% trimmed-mean CPI are measures of core inflation calculated by the Federal Reserve Bank of Cleveland based on data released in the Bureau of Labor Statistics’ (BLS) monthly CPI report".
 Click on graph for larger image.
This graph shows the year-over-year change for these four key measures of inflation.
Note: The Cleveland Fed released the median CPI details. "Motor fuel" decreased at a 45% annualized rate in October. Rent and Owner's equivalent rent are still high, but decreasing.
YoY Measures of Inflation: Services, Goods and Shelter
by Calculated Risk on 11/14/2023 09:21:00 AM
Here are a few measures of inflation:
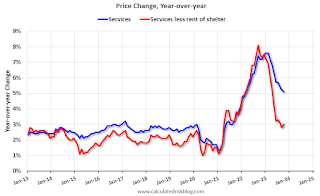
The first graph is the one Fed Chair Powell had mentioned earlier when services less rent of shelter was up 7.6% year-over-year. This has fallen sharply and is now up 3.0% YoY.

This graph shows the YoY price change for Services and Services less rent of shelter through September 2023.
Services less rent of shelter was up 3.0% YoY in October, up from 2.8% YoY in September.
 The second graph shows that goods prices started to increase year-over-year (YoY) in 2020 and accelerated in 2021 due to both strong demand and supply chain disruptions.
Commodities less food and energy commodities were unchanged YoY in October, unchanged from 0.0% YoY in September.
 Here is a graph of the year-over-year change in shelter from the CPI report (through October) and housing from the PCE report (through September 2023)
Shelter was up 6.7% year-over-year in October, down from 7.1% in September. Housing (PCE) was up 7.2% YoY in September, down from 7.4% in August.
The BLS noted this morning: "The index for shelter continued to rise in October"
Core CPI ex-shelter was up 2.0% YoY in October, up from 1.9% in September.
BLS: CPI Unchanged in October; Core CPI increased 0.2%
by Calculated Risk on 11/14/2023 08:32:00 AM
The Consumer Price Index for All Urban Consumers (CPI-U) was unchanged in October on a seasonally adjusted basis, after increasing 0.4 percent in September, the U.S. Bureau of Labor Statistics reported today. Over the last 12 months, the all items index increased 3.2 percent before seasonal adjustment.CPI and core CPI were lower than expectated. I'll post a graph later today after the Cleveland Fed releases the median and trimmed-mean CPI.
The index for shelter continued to rise in October, offsetting a decline in the gasoline index and resulting in the seasonally adjusted index being unchanged over the month. The energy index fell 2.5 percent over the month as a 5.0-percent decline in the gasoline index more than offset increases in other energy component indexes. The food index increased 0.3 percent in October, after rising 0.2 percent in September. The index for food at home increased 0.3 percent over the month while the index for food away from home rose 0.4 percent.
The index for all items less food and energy rose 0.2 percent in October, after rising 0.3 percent in September. Indexes which increased in October include rent, owners' equivalent rent, motor vehicle insurance, medical care, recreation, and personal care. The indexes for lodging away from home, used cars and trucks, communication, and airline fares were among those that decreased over the month.
The all items index rose 3.2 percent for the 12 months ending October, a smaller increase than the 3.7-percent increase for the 12 months ending September. The all items less food and energy index rose 4.0 percent over the last 12 months, its smallest 12-month change since the period ending in September 2021. The energy index decreased 4.5 percent for the 12 months ending October, and the food index increased 3.3 percent over the last year.
emphasis added
Monday, November 13, 2023
Tuesday: CPI
by Calculated Risk on 11/13/2023 07:31:00 PM

Mortgage rates began the day at the highest levels in nearly 2 weeks. The underlying bond market had been losing ground steadily since last Thursday and there was some follow-through to that negative momentum early today. Weaker bonds = higher rates, all other things being equal.Tuesday:
But bonds recovered from 10am through the end of the day and the specific bonds that underlie mortgage rates did even better than their Treasury benchmarks.[30 year fixed 7.58%]
emphasis added
• At 6:00 AM ET, NFIB Small Business Optimism Index for October.
• At 8:30 AM, The Consumer Price Index for October from the BLS. The consensus is for a 0.1% increase in CPI, and a 0.3% increase in core CPI. The consensus is for CPI to be up 3.3% year-over-year and core CPI to be up 4.1% YoY.


