by Calculated Risk on 11/18/2023 02:11:00 PM
Saturday, November 18, 2023
Real Estate Newsletter Articles this Week: New Census Long-Term Population Projections Are MASSIVELY Lower Than Previous Projections
At the Calculated Risk Real Estate Newsletter this week:
• Lawler: Early Read on Existing Home Sales in October
• October Housing Starts: Near Record Number of Multi-Family Housing Units Under Construction
• 3rd Look at Local Housing Markets in October
• Lawler: New Census Long-Term Population Projections Are MASSIVELY Lower Than Previous Projections
• Part 2: Current State of the Housing Market; Overview for mid-November
This is usually published 4 to 6 times a week and provides more in-depth analysis of the housing market.
You can subscribe at https://calculatedrisk.substack.com/
Schedule for Week of November 19, 2023
by Calculated Risk on 11/18/2023 08:11:00 AM
The key economic report this week is Existing Home sales.
No major economic releases scheduled.
8:30 AM ET: Chicago Fed National Activity Index for October. This is a composite index of other data.
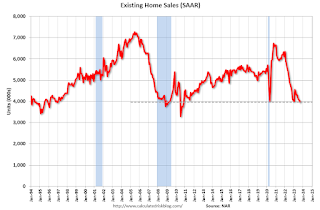 10:00 AM: Existing Home Sales for October from the National Association of Realtors (NAR). The consensus is for 3.93 million SAAR, down from 3.96 million in September.
The graph shows existing home sales from 1994 through the report last month.
2:00 PM: FOMC Minutes, Meeting of October 31-November 1
7:00 AM ET: The Mortgage Bankers Association (MBA) will release the results for the mortgage purchase applications index.
8:30 AM: The initial weekly unemployment claims report will be released. The consensus is for 229 thousand initial claims, down from 231 thousand last week.
8:30 AM: Durable Goods Orders for October from the Census Bureau. The consensus is for a 3.0% decrease in durable goods orders.
10:00 AM: University of Michigan's Consumer sentiment index (Final for November).
All US markets will be closed in observance of the Thanksgiving Day Holiday.
The NYSE and the NASDAQ will close early at 1:00 PM ET.
Friday, November 17, 2023
Nov 17th COVID Update: Deaths and Hospitalizations Decreased
by Calculated Risk on 11/17/2023 07:23:00 PM

| COVID Metrics | ||||
|---|---|---|---|---|
| Now | Week Ago | Goal | ||
| Hospitalized2🚩 | 12,974 | 12,647 | ≤3,0001 | |
| Deaths per Week2 | 1,130 | 1,265 | ≤3501 | |
| 1my goals to stop weekly posts, 2Weekly for Currently Hospitalized, and Deaths 🚩 Increasing number weekly for Hospitalized and Deaths ✅ Goal met. | ||||
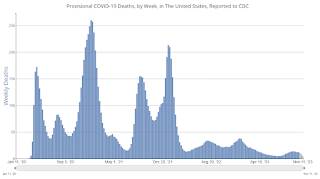 Click on graph for larger image.
This graph shows the weekly (columns) number of deaths reported.
Q4 GDP Tracking: Close to 2%
by Calculated Risk on 11/17/2023 04:22:00 PM
From Goldman:
We boosted our Q4 GDP tracking estimate by 0.1pp to +1.9% (qoq ar) and our domestic final sales estimate by 0.1pp to 2.0%. [Nov 17th estimate]And from the Altanta Fed: GDPNow
emphasis added
The GDPNow model estimate for real GDP growth (seasonally adjusted annual rate) in the fourth quarter of 2023 is 2.0 percent on November 17, down from 2.2 percent on November 15. [Nov 17th estimate]
Lawler: Early Read on Existing Home Sales in October
by Calculated Risk on 11/17/2023 01:16:00 PM
Today, in the CalculatedRisk Real Estate Newsletter: Lawler: Early Read on Existing Home Sales in October
Excerpt:
Chart of the Week: Mortgage Rates Follow MBS Yields, Not 10-Year Treasury YieldsThere is much more in the post. You can subscribe at https://calculatedrisk.substack.com/
For an explanation of “why”, see Lawler: Update on Mortgage/Treasury Spreads
From Tom Lawler:
30 Year FRM: Optimal Blue Conventional Conforming 30-year Fixed-Rate Mortgage where LTV<=80% and FICO>740.
CC MBS Yield: Yield on notional par agency 30-year MBS
Note: there is some “spurious” volatility in the mortgage spreads because Optimal Blue measures rate lock activity throughout the day while the MBS and Treasury yields reflect late afternoon yields.
October Housing Starts: Near Record Number of Multi-Family Housing Units Under Construction
by Calculated Risk on 11/17/2023 09:19:00 AM
Today, in the CalculatedRisk Real Estate Newsletter: October Housing Starts: Near Record Number of Multi-Family Housing Units Under Construction
Excerpt:
The third graph shows the month-to-month comparison for total starts between 2022 (blue) and 2023 (red).There is much more in the post. You can subscribe at https://calculatedrisk.substack.com/
Total starts were down 4.2% in October compared to October 2022. And starts year-to-date are down 11.3% compared to last year.
Starts have been down year-over-year for 16 of the last 18 months (May and July 2023 were the exceptions), and total starts will be down this year - although the year-over-year comparisons are somewhat easier in Q4.
Housing Starts Increased to 1.372 million Annual Rate in October
by Calculated Risk on 11/17/2023 08:30:00 AM
From the Census Bureau: Permits, Starts and Completions
Housing Starts:
Privately‐owned housing starts in October were at a seasonally adjusted annual rate of 1,372,000. This is 1.9 percent above the revised September estimate of 1,346,000, but is 4.2 percent below the October 2022 rate of 1,432,000. Single‐family housing starts in October were at a rate of 970,000; this is 0.2 percent above the revised September figure of 968,000. The October rate for units in buildings with five units or more was 382,000.
Building Permits:
Privately‐owned housing units authorized by building permits in October were at a seasonally adjusted annual rate of 1,487,000. This is 1.1 percent above the revised September rate of 1,471,000, but is 4.4 percent below the October 2022 rate of 1,555,000. Single‐family authorizations in October were at a rate of 968,000; this is 0.5 percent above the revised September figure of 963,000. Authorizations of units in buildings with five units or more were at a rate of 469,000 in October.
emphasis added
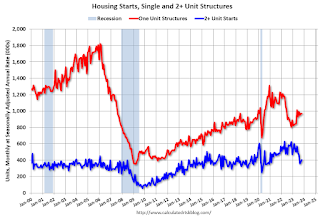 Click on graph for larger image.
The first graph shows single and multi-family housing starts since 2000.
Multi-family starts (blue, 2+ units) increased in October compared to September. Multi-family starts were down 30.0% year-over-year in October.
Single-family starts (red) increased in October and were up 13.1% year-over-year.
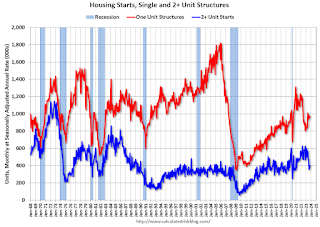 The second graph shows single and multi-family housing starts since 1968.
 This shows the huge collapse following the housing bubble, and then the eventual recovery - and the recent collapse in single-family starts.
Total housing starts in October were above expectations and starts in August and September were revised up, combined.
I'll have more later …
Thursday, November 16, 2023
Friday: Housing Starts
by Calculated Risk on 11/16/2023 08:01:00 PM

Friday:
• At 8:30 AM ET, Housing Starts for October. The consensus is for 1.345 million SAAR, down from 1.358 million SAAR.
• At 10:00 AM, State Employment and Unemployment (Monthly) for October 2023
Realtor.com Reports Active Inventory UP YoY
by Calculated Risk on 11/16/2023 01:10:00 PM
Realtor.com has monthly and weekly data on the existing home market. Here is their weekly report: Weekly Housing Trends View — Data Week Ending Nov 11, 2023
• Active inventory increased slightly, with for-sale homes 0.6% above year ago levels.
For 20 straight weeks, the number of homes available for sale registered below that of the previous year. However, active listings exceeded last year’s levels this week, reversing the recent trend.
• New listings–a measure of sellers putting homes up for sale–were up this week, by 6.4% from one year ago.
Since mid-2022, new listings have registered lower than prior year levels, as the mortgage rate lock-in effect freezes homeowners with low-rate existing mortgages in place. Over the last three weeks, however, the trend has reversed as new listings during the week outpaced the same week in the previous year by 6.4%, a jump relative to the previous week.
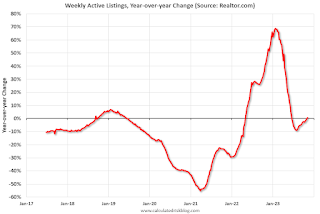 Here is a graph of the year-over-year change in inventory according to realtor.com.
 Inventory was up 0.6% year-over-year following 20 consecutive weeks with a YoY decrease in inventory.
NAHB: Builder Confidence Decreased in November
by Calculated Risk on 11/16/2023 10:00:00 AM
The National Association of Home Builders (NAHB) reported the housing market index (HMI) was at 34, down from 40 last month. Any number below 50 indicates that more builders view sales conditions as poor than good.
From the NAHB: Builder Sentiment Down Again, but Better Building Conditions are in View
High mortgage rates that approached 8% earlier this month continue to hammer builder confidence, but recent economic data suggest housing conditions may improve in the coming months.
Builder confidence in the market for newly built single-family homes in November fell six points to 34 in November, according to the National Association of Home Builders (NAHB)/Wells Fargo Housing Market Index (HMI) released today. This is the fourth consecutive monthly drop in builder confidence, as sentiment levels have declined 22 points since July and are at their lowest level since December 2022. Also of note, nearly the entire HMI data for November was collected before the latest Consumer Price Index was released and showed that inflation is moderating.
“The rise in interest rates since the end of August has dampened builder views of market conditions, as a large number of prospective buyers were priced out of the market,” said NAHB Chairman Alicia Huey, a custom home builder and developer from Birmingham, Ala. “Moreover, higher short-term interest rates have increased the cost of financing for home builders and land developers, adding another headwind for housing supply in a market low on resale inventory. While the Federal Reserve is fighting inflation, state and local policymakers could also help by reducing the regulatory burdens on the cost of land development and home building, thereby allowing more attainable housing supply to the market.”
“While builder sentiment was down again in November, recent macroeconomic data point to improving conditions for home construction in the coming months,” said NAHB Chief Economist Robert Dietz. “In particular, the 10-year Treasury rate moved back to the 4.5% range for the first time since late September, which will help bring mortgage rates close to or below 7.5%. Given the lack of existing home inventory, somewhat lower mortgage rates will price-in housing demand and likely set the stage for improved builder views of market conditions in December.”
...
All three major HMI indices posted declines in November. The HMI index gauging current sales conditions fell six points to 40, the component charting sales expectations in the next six months dropped five points to 39 and the gauge measuring traffic of prospective buyers dipped five points to 21.
Looking at the three-month moving averages for regional HMI scores, the Northeast fell one point to 49, the Midwest dropped three points to 36, the South fell seven points to 42 and the West posted a six-point decline to 35.
emphasis added
 Click on graph for larger image.
This graph shows the NAHB index since Jan 1985.
This was below the consensus forecast.


