 RSS Feed
 by Calculated Risk on 11/20/2023 10:11:00 AM
Monday, November 20, 2023
LA Port Inbound Traffic Increases in October
Notes: The expansion to the Panama Canal was completed in 2016 (As I noted several years ago), and some of the traffic that used the ports of Los Angeles and Long Beach is probably going through the canal. This might be impacting TEUs on the West Coast (recently the drought in Panama has slowed canal traffic).
Container traffic gives us an idea about the volume of goods being exported and imported - and usually some hints about the trade report since LA area ports handle about 40% of the nation's container port traffic.
The following graphs are for inbound and outbound traffic at the ports of Los Angeles and Long Beach in TEUs (TEUs: 20-foot equivalent units or 20-foot-long cargo container).
To remove the strong seasonal component for inbound traffic, the first graph shows the rolling 12-month average.
 Click on graph for larger image.
On a rolling 12-month basis, inbound traffic increased 1.3% in October compared to the rolling 12 months ending in September. Outbound traffic increased 0.1% compared to the rolling 12 months ending the previous month.
The 2nd graph is the monthly data (with a strong seasonal pattern for imports).
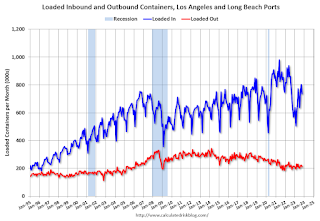 Usually imports peak in the July to October period as retailers import goods for the Christmas holiday, and then decline sharply and bottom in February or March depending on the timing of the Chinese New Year.
 Usually imports peak in the July to October period as retailers import goods for the Christmas holiday, and then decline sharply and bottom in February or March depending on the timing of the Chinese New Year.
 Imports were up 17% YoY in October, and exports were up 1% YoY. It appears traffic is returning to the pre-pandemic patterns.
Housing November 20th Weekly Update: Inventory Up Slightly Year-over-year
by Calculated Risk on 11/20/2023 08:21:00 AM
Altos reports that active single-family inventory was up 0.5% week-over-week and is now up slightly year-over-year. This is the latest in the year that inventory was still increasing in this series! Inventory will start decreasing seasonally soon (for Thanksgiving and Christmas).
 Click on graph for larger image.
This inventory graph is courtesy of Altos Research.
As of November 17th, inventory was at 570 thousand (7-day average), compared to 567 thousand the prior week.
Year-to-date, inventory is up 16.1%. And inventory is up 40.3% from the seasonal bottom 31 weeks ago.

The red line is for 2023. The black line is for 2019. Note that inventory is up from the record low for the same week in 2021, but below last year and still well below normal levels.
Inventory was up 0.1% compared to the same week in 2022 (last week it was down 0.9%), and down 35.7% compared to the same week in 2019 (last week down 36.5%).
In 2022, inventory peaked at the end of October (the latest in the year inventory had peaked in this series until this year).
Inventory is now solidly above the same week in 2020 levels (dark blue line).
Mike Simonsen discusses this data regularly on Youtube.
Sunday, November 19, 2023
Sunday Night Futures
by Calculated Risk on 11/19/2023 06:51:00 PM
Weekend:
• Schedule for Week of November 19, 2023
Monday:
• No major economic releases scheduled.
From CNBC: Pre-Market Data and Bloomberg futures S&P 500 futures are down 5 and DOW futures are down 11 (fair value).
Oil prices were down over the last week with WTI futures at $75.89 per barrel and Brent at $80.61 per barrel. A year ago, WTI was at $80, and Brent was at $89 - so WTI oil prices were down 5% year-over-year.
Here is a graph from Gasbuddy.com for nationwide gasoline prices. Nationally prices are at $3.25 per gallon. A year ago, prices were at $3.65 per gallon, so gasoline prices are down $0.40 year-over-year.
Hotels: Occupancy Rate Increased 0.8% Year-over-year
by Calculated Risk on 11/19/2023 08:31:00 AM
U.S. hotel performance increased from the previous week and showed positive year-over-year comparisons, according to CoStar’s latest data through 11 November.The following graph shows the seasonal pattern for the hotel occupancy rate using the four-week average.
5-11 November 2023 (percentage change from comparable week in 2022):
• Occupancy: 64.8% (+0.8%)
• Average daily rate (ADR): US$156.01 (+4.0%)
• Revenue per available room (RevPAR): US$101.13 (+4.9%)
emphasis added
 Click on graph for larger image.
The red line is for 2023, black is 2020, blue is the median, and dashed light blue is for 2022. Dashed purple is for 2018, the record year for hotel occupancy.
The 4-week average of the occupancy rate is tracking close to last year, and above the median rate for the period 2000 through 2022 (Blue).
Note: Y-axis doesn't start at zero to better show the seasonal change.
The 4-week average of the occupancy rate will decline seasonally for the next couple of months.
Saturday, November 18, 2023
Real Estate Newsletter Articles this Week: New Census Long-Term Population Projections Are MASSIVELY Lower Than Previous Projections
by Calculated Risk on 11/18/2023 02:11:00 PM
At the Calculated Risk Real Estate Newsletter this week:
• Lawler: Early Read on Existing Home Sales in October
• October Housing Starts: Near Record Number of Multi-Family Housing Units Under Construction
• 3rd Look at Local Housing Markets in October
• Lawler: New Census Long-Term Population Projections Are MASSIVELY Lower Than Previous Projections
• Part 2: Current State of the Housing Market; Overview for mid-November
This is usually published 4 to 6 times a week and provides more in-depth analysis of the housing market.
You can subscribe at https://calculatedrisk.substack.com/
Schedule for Week of November 19, 2023
by Calculated Risk on 11/18/2023 08:11:00 AM
The key economic report this week is Existing Home sales.
No major economic releases scheduled.
8:30 AM ET: Chicago Fed National Activity Index for October. This is a composite index of other data.
 10:00 AM: Existing Home Sales for October from the National Association of Realtors (NAR). The consensus is for 3.93 million SAAR, down from 3.96 million in September.
The graph shows existing home sales from 1994 through the report last month.
2:00 PM: FOMC Minutes, Meeting of October 31-November 1
7:00 AM ET: The Mortgage Bankers Association (MBA) will release the results for the mortgage purchase applications index.
8:30 AM: The initial weekly unemployment claims report will be released. The consensus is for 229 thousand initial claims, down from 231 thousand last week.
8:30 AM: Durable Goods Orders for October from the Census Bureau. The consensus is for a 3.0% decrease in durable goods orders.
10:00 AM: University of Michigan's Consumer sentiment index (Final for November).
All US markets will be closed in observance of the Thanksgiving Day Holiday.
The NYSE and the NASDAQ will close early at 1:00 PM ET.
Friday, November 17, 2023
Nov 17th COVID Update: Deaths and Hospitalizations Decreased
by Calculated Risk on 11/17/2023 07:23:00 PM
 Note: Mortgage rates are from MortgageNewsDaily.com and are for top tier scenarios.
Due to changes at the CDC, weekly cases are no longer updated.
For deaths, I'm currently using 3 weeks ago for "now", since the most recent two weeks will be revised significantly.
Hospitalizations have more than doubled from a low of 5,150 in June 2023.
Hospitalizations are far below the peak of 150,000 in January 2022.
| COVID Metrics | ||||
|---|---|---|---|---|
| Now | Week Ago | Goal | ||
| Hospitalized2🚩 | 12,974 | 12,647 | ≤3,0001 | |
| Deaths per Week2 | 1,130 | 1,265 | ≤3501 | |
| 1my goals to stop weekly posts, 2Weekly for Currently Hospitalized, and Deaths 🚩 Increasing number weekly for Hospitalized and Deaths ✅ Goal met. | ||||
 Click on graph for larger image.
This graph shows the weekly (columns) number of deaths reported.
Weekly deaths have more than doubled from a low of 485 in early July but have declined recently. Weekly deaths are far below the weekly peak of 26,000 in January 2021.
Q4 GDP Tracking: Close to 2%
by Calculated Risk on 11/17/2023 04:22:00 PM
From Goldman:
We boosted our Q4 GDP tracking estimate by 0.1pp to +1.9% (qoq ar) and our domestic final sales estimate by 0.1pp to 2.0%. [Nov 17th estimate]And from the Altanta Fed: GDPNow
emphasis added
The GDPNow model estimate for real GDP growth (seasonally adjusted annual rate) in the fourth quarter of 2023 is 2.0 percent on November 17, down from 2.2 percent on November 15. [Nov 17th estimate]
Lawler: Early Read on Existing Home Sales in October
by Calculated Risk on 11/17/2023 01:16:00 PM
Today, in the CalculatedRisk Real Estate Newsletter: Lawler: Early Read on Existing Home Sales in October
Excerpt:
Chart of the Week: Mortgage Rates Follow MBS Yields, Not 10-Year Treasury YieldsThere is much more in the post. You can subscribe at https://calculatedrisk.substack.com/
For an explanation of “why”, see Lawler: Update on Mortgage/Treasury Spreads
From Tom Lawler:
30 Year FRM: Optimal Blue Conventional Conforming 30-year Fixed-Rate Mortgage where LTV<=80% and FICO>740.
CC MBS Yield: Yield on notional par agency 30-year MBS
Note: there is some “spurious” volatility in the mortgage spreads because Optimal Blue measures rate lock activity throughout the day while the MBS and Treasury yields reflect late afternoon yields.

October Housing Starts: Near Record Number of Multi-Family Housing Units Under Construction
by Calculated Risk on 11/17/2023 09:19:00 AM
Today, in the CalculatedRisk Real Estate Newsletter: October Housing Starts: Near Record Number of Multi-Family Housing Units Under Construction
Excerpt:
The third graph shows the month-to-month comparison for total starts between 2022 (blue) and 2023 (red).There is much more in the post. You can subscribe at https://calculatedrisk.substack.com/
Total starts were down 4.2% in October compared to October 2022. And starts year-to-date are down 11.3% compared to last year.
Starts have been down year-over-year for 16 of the last 18 months (May and July 2023 were the exceptions), and total starts will be down this year - although the year-over-year comparisons are somewhat easier in Q4.


