 RSS Feed
 by Calculated Risk on 11/22/2023 07:00:00 AM
Wednesday, November 22, 2023
MBA: Mortgage Applications Increased in Weekly Survey
From the MBA: Mortgage Applications Increase in Latest MBA Weekly Survey
Mortgage applications increased 3.0 percent from one week earlier, according to data from the Mortgage Bankers Association’s (MBA) Weekly Mortgage Applications Survey for the week ending November 17, 2023.
The Market Composite Index, a measure of mortgage loan application volume, increased 3.0 percent on a seasonally adjusted basis from one week earlier. On an unadjusted basis, the Index decreased 0.1 percent compared with the previous week. The Refinance Index increased 2 percent from the previous week and was 4 percent lower than the same week one year ago. The seasonally adjusted Purchase Index increased 4 percent from one week earlier. The unadjusted Purchase Index decreased 1 percent compared with the previous week and was 20 percent lower than the same week one year ago.
“U.S. bond yields continued to move lower as incoming data signaled a softer economy and more signs of cooling inflation. Most mortgage rates in our survey decreased, with the 30-year fixed mortgage rate decreasing to 7.41 percent, the lowest rate in two months,” said Joel Kan, MBA’s Vice President and Deputy Chief Economist. “Mortgage applications increased to their highest level in six weeks, but remain at very low levels. Purchase applications were up almost four percent over the week, on a seasonally adjusted basis, as both conventional and government purchase loans saw increases. The average loan size on a purchase application was $403,600, the lowest since January 2023. This is consistent with other sources of home sales data showing a gradually increasing first-time homebuyer share.”
Added Kan, “Refinance applications increased 1.6 percent last week, but the level of refinances continues to be well below historical averages, given that most borrowers already have a rate well below current market rates.”
...
The average contract interest rate for 30-year fixed-rate mortgages with conforming loan balances ($726,200 or less) decreased to 7.41 percent from 7.61 percent, with points decreasing to 0.62 from 0.67 (including the origination fee) for 80 percent loan-to-value ratio (LTV) loans.
emphasis added
 Click on graph for larger image.
The first graph shows the MBA mortgage purchase index.
According to the MBA, purchase activity is down 20% year-over-year unadjusted.
Red is a four-week average (blue is weekly). Other than the previous five weeks, the purchase index was at the lowest level since 1995.

The second graph shows the refinance index since 1990.
With higher mortgage rates, the refinance index declined sharply in 2022 - and has mostly flat lined at a low level since then.
Tuesday, November 21, 2023
Wednesday: Unemployment Claims, Durable Goods
by Calculated Risk on 11/21/2023 08:38:00 PM
 Note: Mortgage rates are from MortgageNewsDaily.com and are for top tier scenarios.
Wednesday:
• At 7:00 AM ET, The Mortgage Bankers Association (MBA) will release the results for the mortgage purchase applications index.
• At 8:30 AM, The initial weekly unemployment claims report will be released. The consensus is for 229 thousand initial claims, down from 231 thousand last week.
• Also at 8:30 AM, Durable Goods Orders for October from the Census Bureau. The consensus is for a 3.0% decrease in durable goods orders.
• At 10:00 AM, University of Michigan's Consumer sentiment index (Final for November).
FOMC Minutes: "All participants agreed that the Committee was in a position to proceed carefully"
by Calculated Risk on 11/21/2023 02:00:00 PM
From the Fed: Minutes of the Federal Open Market Committee, October 31–November 1, 2023. Excerpt:
Participants noted that real GDP had expanded at an unexpectedly strong pace in the third quarter, boosted by a surge in consumer spending. Nevertheless, participants judged that aggregate demand and aggregate supply continued to come into better balance, as a result of the current restrictive stance of monetary policy and the continued normalization of aggregate supply conditions. Participants assessed that while labor market conditions remained tight, they had eased since earlier in the year, partly as a result of recent increases in labor supply. Participants judged that the current stance of monetary policy was restrictive and was putting downward pressure on economic activity and inflation. In addition, they noted that financial conditions had tightened significantly in recent months. Participants noted that inflation had moderated over the past year but stressed that current inflation remained unacceptably high and well above the Committee's longer-run goal of 2 percent. They also stressed that further evidence would be required for them to be confident that inflation was clearly on a path to the Committee's 2 percent objective. Participants continued to view a period of below-potential growth in real GDP and some further softening in labor market conditions as likely to be needed to reduce inflation pressures sufficiently to return inflation to 2 percent over time.
...
In discussing the policy outlook, participants continued to judge that it was critical that the stance of monetary policy be kept sufficiently restrictive to return inflation to the Committee's 2 percent objective over time. All participants agreed that the Committee was in a position to proceed carefully and that policy decisions at every meeting would continue to be based on the totality of incoming information and its implications for the economic outlook as well as the balance of risks. Participants noted that further tightening of monetary policy would be appropriate if incoming information indicated that progress toward the Committee's inflation objective was insufficient. Participants expected that the data arriving in coming months would help clarify the extent to which the disinflation process was continuing, aggregate demand was moderating in the face of tighter financial and credit conditions, and labor markets were reaching a better balance between demand and supply. Participants noted the importance of continuing to communicate clearly about the Committee's data-dependent approach and its firm commitment to bring inflation down to 2 percent.
All participants judged that it would be appropriate for policy to remain at a restrictive stance for some time until inflation is clearly moving down sustainably toward the Committee's objective. Participants also observed that the continuing process of reducing the size of the Federal Reserve's balance sheet was an important part of the overall approach to achieving their macroeconomic objectives. A few participants noted that the process of balance sheet runoff could continue for some time, even after the Committee begins to reduce the target range for the federal funds rate. Several participants commented on the recent decline in the use of the ON RRP facility, noting that the use of the facility had been responsive to market conditions.
emphasis added
NAR: Existing-Home Sales Decreased to 3.79 million SAAR in October; New Cycle Low, Months-of-Supply Close to 2019 Levels
by Calculated Risk on 11/21/2023 10:54:00 AM
Today, in the CalculatedRisk Real Estate Newsletter: NAR: Existing-Home Sales Decreased to 3.79 million SAAR in October; New Cycle Low
Excerpt:
Sales Year-over-Year and Not Seasonally Adjusted (NSA)There is much more in the article. You can subscribe at https://calculatedrisk.substack.com/ Please subscribe!
The fourth graph shows existing home sales by month for 2022 and 2023.
Sales declined 14.6% year-over-year compared to October 2022. This was the twenty-sixth consecutive month with sales down year-over-year. This was a new cycle low, below the 3.95 million SAAR in September 2023.

NAR: Existing-Home Sales Decreased to 3.79 million SAAR in October
by Calculated Risk on 11/21/2023 10:00:00 AM
From the NAR: Existing-Home Sales Receded 4.1% in October
Existing-home sales dropped in October, according to the National Association of REALTORS®. Among the four major U.S. regions, sales slid in the Northeast, South and West but were unchanged in the Midwest. All four regions experienced year-over-year sales declines.
Total existing-home sales – completed transactions that include single-family homes, townhomes, condominiums and co-ops – fell 4.1% from September to a seasonally adjusted annual rate of 3.79 million in October. Year-over-year, sales tumbled 14.6% (down from 4.44 million in October 2022).
...
Total housing inventory registered at the end of October was 1.15 million units, up 1.8% from September but down 5.7% from one year ago (1.22 million). Unsold inventory sits at a 3.6-month supply at the current sales pace, up from 3.4 months in September and 3.3 months in October 2022.
emphasis added
 Click on graph for larger image.
This graph shows existing home sales, on a Seasonally Adjusted Annual Rate (SAAR) basis since 1994.
Sales in October (3.79 million SAAR) were down 4.1% from the previous month and were 14.6% below the October 2022 sales rate.
The second graph shows nationwide inventory for existing homes.
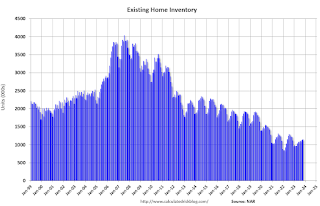 According to the NAR, inventory increased to 1.15 million in October from 1.13 million the previous month.
 According to the NAR, inventory increased to 1.15 million in October from 1.13 million the previous month.
Headline inventory is not seasonally adjusted, and inventory usually decreases to the seasonal lows in December and January, and peaks in mid-to-late summer.
The last graph shows the year-over-year (YoY) change in reported existing home inventory and months-of-supply. Since inventory is not seasonally adjusted, it really helps to look at the YoY change. Note: Months-of-supply is based on the seasonally adjusted sales and not seasonally adjusted inventory.
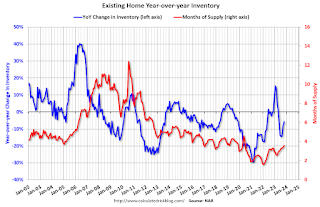 Inventory was down 5.7% year-over-year (blue) in October compared to October 2022.
Months of supply (red) increased to 3.6 months in October from 3.4 months the previous month.
This was below the consensus forecast. I'll have more later.
The last graph shows the year-over-year (YoY) change in reported existing home inventory and months-of-supply. Since inventory is not seasonally adjusted, it really helps to look at the YoY change. Note: Months-of-supply is based on the seasonally adjusted sales and not seasonally adjusted inventory.
 Inventory was down 5.7% year-over-year (blue) in October compared to October 2022.
 Months of supply (red) increased to 3.6 months in October from 3.4 months the previous month.
This was below the consensus forecast. I'll have more later.
Monday, November 20, 2023
Tuesday: Existing Home Sales, FOMC Minutes
by Calculated Risk on 11/20/2023 07:08:00 PM
 From Matthew Graham at Mortgage News Daily: Boring Day For Mortgage Rates, But That's a Good Thing
Mortgage rates moved down to the lowest levels in roughly 2 months last week. ... "Low" is relative, of course. Before September, today's rates would have been depressingly high, but they represent significant progress from October's multi-decade highs of over 8% for conventional 30yr fixed rates. For the same scenario, today's rates are down 5/8ths of a percent from those peaks. [30 year fixed 7.38%]Tuesday:
emphasis added
• At 8:30 AM ET, Chicago Fed National Activity Index for October. This is a composite index of other data.
• At 10:00 AM, Existing Home Sales for October from the National Association of Realtors (NAR). The consensus is for 3.93 million SAAR, down from 3.96 million in September.
• At 2:00 PM, FOMC Minutes, Meeting of October 31-November 1
MBA Survey: "Share of Mortgage Loans in Forbearance Decreases to 0.29% in October"
by Calculated Risk on 11/20/2023 04:37:00 PM
From the MBA: Share of Mortgage Loans in Forbearance Decreases to 0.29% in October
The Mortgage Bankers Association’s (MBA) monthly Loan Monitoring Survey revealed that the total number of loans now in forbearance decreased by 2 basis points from 0.31% of servicers’ portfolio volume in the prior month to 0.29% as of October 31, 2023. According to MBA’s estimate, 145,000 homeowners are in forbearance plans. Mortgage servicers have provided forbearance to approximately 8 million borrowers since March 2020.
In October 2023, the share of Fannie Mae and Freddie Mac loans in forbearance remained flat at 0.18%. Ginnie Mae loans in forbearance decreased 5 basis points to 0.52%, and the forbearance share for portfolio loans and private-label securities (PLS) decreased 3 basis points to 0.32%.
“For the first time since MBA began tracking the reasons for forbearance in October 2022, temporary hardships such as job loss, death, and divorce represent a larger share of loans in forbearance by reason than a COVID-19 hardship,” said Marina Walsh, CMB, MBA’s Vice President of Industry Analysis. “This upward trend will continue, as Fannie Mae and Freddie Mac sunset the use of COVID-19 as a reason for delinquency starting in November 2023,[1] and FHA’s COVID-19 forbearance period ends at the end of November 2023[2].”
Added Walsh, “Forbearance is still an option for many distressed homeowners, but in most cases, the requirements to obtain a forbearance will not be as streamlined as they were during the pandemic.”
emphasis added
 Click on graph for larger image.
This graph shows the reasons for forbearance: COVID-19, Naturnal Disaster, other Temporary Hardship.
From the MBA:
• By reason, 45.4% of borrowers are in forbearance for reasons such as a temporary hardship caused by job loss, death, divorce, or disability; while 43.3% of borrowers are in forbearance because of COVID-19. Another 11.3% are in forbearance because of a natural disaster.At the end of October, there were about 145,000 homeowners in forbearance plans.
4th Look at Local Housing Markets in October
by Calculated Risk on 11/20/2023 12:56:00 PM
Today, in the Calculated Risk Real Estate Newsletter: 4th Look at Local Housing Markets in October
A brief excerpt:
The National Association of Realtors (NAR) is scheduled to release October existing home sales on Tuesday, November 21, 2023, at 10:00 AM ET. The consensus is for 3.93 million SAAR. Housing economist Tom Lawler expects the NAR to report sales of 3.94 million SAAR. This would be a new cycle low, below the 4.00 million SAAR in January 2023.There is much more in the article. You can subscribe at https://calculatedrisk.substack.com/
NOTE: Starting next month, I’ll add some comparisons to 2019 data (pre-pandemic)!
...
In October, sales in these markets were down 9.4%. In September, these same markets were down 15.7% YoY Not Seasonally Adjusted (NSA).
This is a smaller YoY decline NSA than in September for these markets. However, this is where seasonal adjustments make a difference.
There was one more working day in October 2023 compared to October 2022, the opposite of September when there was one fewer working day in 2023 compared to 2022. So, for October, the seasonally adjusted decline will be larger than the NSA decline. This will be the 26th consecutive month with a YoY decline in sales.
...
Several local markets - like Illinois, Miami, New Jersey and New York - will report after the NAR release.

LA Port Inbound Traffic Increases in October
by Calculated Risk on 11/20/2023 10:11:00 AM
Notes: The expansion to the Panama Canal was completed in 2016 (As I noted several years ago), and some of the traffic that used the ports of Los Angeles and Long Beach is probably going through the canal. This might be impacting TEUs on the West Coast (recently the drought in Panama has slowed canal traffic).
Container traffic gives us an idea about the volume of goods being exported and imported - and usually some hints about the trade report since LA area ports handle about 40% of the nation's container port traffic.
The following graphs are for inbound and outbound traffic at the ports of Los Angeles and Long Beach in TEUs (TEUs: 20-foot equivalent units or 20-foot-long cargo container).
To remove the strong seasonal component for inbound traffic, the first graph shows the rolling 12-month average.
 Click on graph for larger image.
On a rolling 12-month basis, inbound traffic increased 1.3% in October compared to the rolling 12 months ending in September. Outbound traffic increased 0.1% compared to the rolling 12 months ending the previous month.
The 2nd graph is the monthly data (with a strong seasonal pattern for imports).
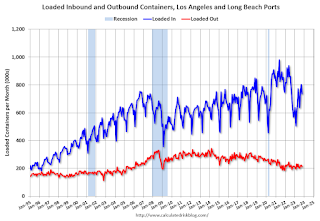 Usually imports peak in the July to October period as retailers import goods for the Christmas holiday, and then decline sharply and bottom in February or March depending on the timing of the Chinese New Year.
 Usually imports peak in the July to October period as retailers import goods for the Christmas holiday, and then decline sharply and bottom in February or March depending on the timing of the Chinese New Year.
 Imports were up 17% YoY in October, and exports were up 1% YoY. It appears traffic is returning to the pre-pandemic patterns.
Housing November 20th Weekly Update: Inventory Up Slightly Year-over-year
by Calculated Risk on 11/20/2023 08:21:00 AM
Altos reports that active single-family inventory was up 0.5% week-over-week and is now up slightly year-over-year. This is the latest in the year that inventory was still increasing in this series! Inventory will start decreasing seasonally soon (for Thanksgiving and Christmas).
 Click on graph for larger image.
This inventory graph is courtesy of Altos Research.
As of November 17th, inventory was at 570 thousand (7-day average), compared to 567 thousand the prior week.
Year-to-date, inventory is up 16.1%. And inventory is up 40.3% from the seasonal bottom 31 weeks ago.

The red line is for 2023. The black line is for 2019. Note that inventory is up from the record low for the same week in 2021, but below last year and still well below normal levels.
Inventory was up 0.1% compared to the same week in 2022 (last week it was down 0.9%), and down 35.7% compared to the same week in 2019 (last week down 36.5%).
In 2022, inventory peaked at the end of October (the latest in the year inventory had peaked in this series until this year).
Inventory is now solidly above the same week in 2020 levels (dark blue line).
Mike Simonsen discusses this data regularly on Youtube.


