 RSS Feed
 by Calculated Risk on 11/23/2023 08:47:00 AM
Thursday, November 23, 2023
Five Economic Reasons to be Thankful
Here are five economic reasons to be thankful this Thanksgiving. (Hat Tip to Neil Irwin who started doing this years ago)
1) The Unemployment Rate is Below 4%
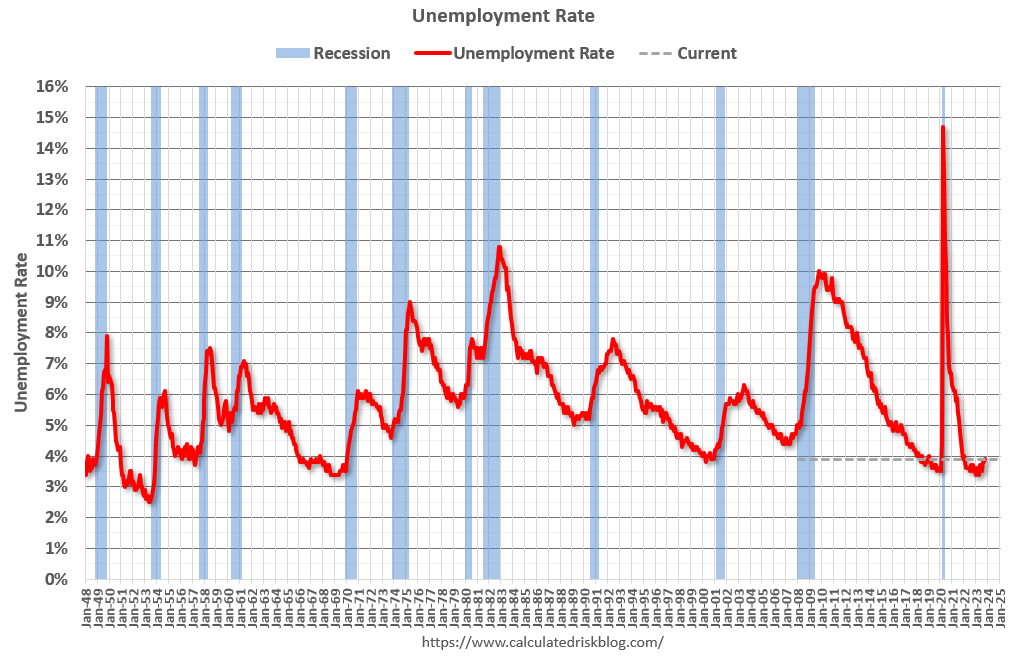 The unemployment rate was at 3.9% in October. The unemployment rate is down from 14.7% in April 2020 (the highest since the Great Depression).
The unemployment rate is up from 3.7% a year ago (October 2022).
This was up from 3.4% in April 2023 - and that matched the lowest unemployment rate since 1969!
2) Low unemployment claims.
 This graph shows the 4-week moving average of weekly claims since 1971.
2) Low unemployment claims.
 This graph shows the 4-week moving average of weekly claims since 1971.
Weekly claims were at 209,000 last week.
The dashed line on the graph is the current 4-week average.
The dashed line on the graph is the current 4-week average.
Even though weekly claims have bounced around a little recently, the 4-week average is close to the lowest level in 50 years.
3) Inflation is Decreasing
 This graph shows the year-over-year change in three measures of inflation since 1970: CPI, Core CPI, and Core CPI ex-shelter.
3) Inflation is Decreasing
 This graph shows the year-over-year change in three measures of inflation since 1970: CPI, Core CPI, and Core CPI ex-shelter.
 CPI was up 3.2% YoY in October, down from the recent peak of 8.9%.
Core CPI was up 4.0% YoY, and Core CPI ex-shelter was up 2.0% YoY in October.
Overall inflation is moving back to the Fed's 2% target.
4) Mortgage Delinquency Rate Near the Lowest Level since at least 1979

Overall inflation is moving back to the Fed's 2% target.
4) Mortgage Delinquency Rate Near the Lowest Level since at least 1979

This graph, based on data from the MBA through Q3 2023, shows the percent of loans delinquent by days past due. Even though delinquencies increased in Q3, mortgage delinquencies were near the lowest level since the MBA survey started in 1979.
Note: The sharp increase in 2020 in the 90-day bucket was due to loans in forbearance (included as delinquent, but not reported to the credit bureaus).
The percent of loans in the foreclosure process decreased year-over-year in Q3 even with the end of the foreclosure moratoriums and are historically low.
5) Household Debt burdens at Low Levels
 This graph, based on data from the Federal Reserve, shows the Total Debt Service Ratio (DSR), and the DSR for mortgages (blue) and consumer debt (yellow).
The Household debt service ratio was at 13.2% in 2007 and has fallen to under 10% now., and the DSR for mortgages (blue) are near the lowest level for the last 35 years.
This data suggests aggregate household cash flow is in a solid position.
This data suggests aggregate household cash flow is in a solid position.
Happy Thanksgiving to All!
Wednesday, November 22, 2023
Black Knight: Mortgage Delinquency Rate Decreased in October
by Calculated Risk on 11/22/2023 02:35:00 PM
From ICE / Black Knight: ICE First Look at Mortgage Performance: Foreclosure starts rose in October, despite serious delinquencies returning to 17-year lows
• The national delinquency rate fell 3 basis points (bps) to 3.26% in October, marking a 9 bps (-2.8%) improvement from the same time last year
• Serious delinquencies (90+ days past due) fell to 447K, once again hitting their lowest levels since 2006
• Loans 30-days late also declined, marking the first such improvement in five months
• Despite the improvement in delinquencies, foreclosure starts rose to 33K in October, hitting their highest levels in 18 months – while the number of foreclosure sales (completions) remained relatively flat
• Active foreclosure inventory inched up 3K to 217K, but remains more than 25% below prepandemic levels
• While foreclosure starts rose in October, near term risk remains muted, with serious delinquencies historically low and more than 70% of such loans protected from foreclosure by loss mitigation efforts
• Prepay activity (measured as single-month mortality) dwindled to just 0.43% under continued seasonal pressure, despite interest rates easing somewhat from the prior month
| Black Knight: Percent Loans Delinquent and in Foreclosure Process | ||||
|---|---|---|---|---|
| October 2023 | September 2023 | |||
| Delinquent | 3.26% | 3.29% | ||
| In Foreclosure | 0.41% | 0.40% | ||
| Number of properties: | ||||
| Number of properties that are delinquent, but not in foreclosure: | 1,734,000 | 1,749,000 | ||
| Number of properties in foreclosure pre-sale inventory: | 217,000 | 214,000 | ||
| Total Properties | 1,951,000 | 1,963,000 | ||
November Vehicle Sales Forecast: 15.8 million SAAR, Up 11% YoY
by Calculated Risk on 11/22/2023 01:30:00 PM
From WardsAuto: November U.S. Light-Vehicle Sales to Improve on Past Three Months (pay content). Brief excerpt:
The recent falloff in the SAAR from summer highs could mean more consumers are reaching price fatigue. It also could be that some of the stronger selling segments – especially fullsize trucks – of the past two-plus years are closer than other segments to meeting the pent-up demand built up since the inventory drain caused by the semiconductor shortage began in early 2021. Of course, there also has been a rise in distractions over that period, locally and internationally.
emphasis added
 Click on graph for larger image.
This graph shows actual sales from the BEA (Blue), and Wards forecast for November (Red).
On a seasonally adjusted annual rate basis, the Wards forecast of 15.8 million SAAR, would be up 2% from last month, and up 11% from a year ago.
Vehicle sales are usually a transmission mechanism for Federal Open Market Committee (FOMC) policy, although far behind housing. This time vehicle sales were more suppressed by supply chain issues.
Lawler on Existing Home Sales, Population Projections and Household Slowdown
by Calculated Risk on 11/22/2023 09:34:00 AM
Today, in the CalculatedRisk Real Estate Newsletter: Lawler on Existing Home Sales, Population Projections and Household Slowdown
Excerpt:
Census’ new long-term US population projections released last Friday were massively lower than the previous long-term projection released in 2017. In a report earlier this week I highlighted the how the projected components of population change (births, deaths, and net international migration) differed in the two forecasts. Today I’m going to highlight a few “issues” with the latest projections over the next few years.There is much more in the article. You can subscribe at https://calculatedrisk.substack.com/ Please subscribe!
First, the “projected” components of change from July 1, 2022, to June 30, 2023, differ significantly from likely components of change based on existing information.
For deaths, the latest projection shows deaths from July 1, 2022, to June 30, 2023, of 2,861,510, a whopping 298,232 lower than CDC provisional data for that period show (this latter number will be revised upward slightly). In looking at deaths by age, mortality rates are “too low” in the latest long-term projection for almost all age groups, but especially for young to middle-aged adults.
For net international migration (NIM), the latest projection shows NIM from July 1, 2022, to June 30, 2023, of 853,220, or a sizeable 157,703 below the estimated NIM from July 1, 2021, to June 30, 2022, in the Vintage 2022 population estimates. Yet the admittedly limited data available on immigration trends suggest the NIM INCREASED from 2022 to 2023, and my best estimate in that NIM from July 1, 2022, to June 30, 2022, was about 1,200,000 – 346,780 higher than the assumption in the latest long-term population projection.
Finally, births in the latest long-term population projection from July 1, 2022, to June 30, 2023, are 18,788 below provisional CDC data for this period.

Weekly Initial Unemployment Claims Decrease to 209,000
by Calculated Risk on 11/22/2023 08:30:00 AM
The DOL reported:
In the week ending November 18, the advance figure for seasonally adjusted initial claims was 209,000, a decrease of 24,000 from the previous week's revised level. The previous week's level was revised up by 2,000 from 231,000 to 233,000. The 4-week moving average was 220,000, a decrease of 750 from the previous week's revised average. The previous week's average was revised up by 500 from 220,250 to 220,750.The following graph shows the 4-week moving average of weekly claims since 1971.
emphasis added
Click on graph for larger image.The dashed line on the graph is the current 4-week average. The four-week average of weekly unemployment claims decreased to 220,000.
The previous week was revised up.
Weekly claims were much lower than the consensus forecast.
MBA: Mortgage Applications Increased in Weekly Survey
by Calculated Risk on 11/22/2023 07:00:00 AM
From the MBA: Mortgage Applications Increase in Latest MBA Weekly Survey
Mortgage applications increased 3.0 percent from one week earlier, according to data from the Mortgage Bankers Association’s (MBA) Weekly Mortgage Applications Survey for the week ending November 17, 2023.
The Market Composite Index, a measure of mortgage loan application volume, increased 3.0 percent on a seasonally adjusted basis from one week earlier. On an unadjusted basis, the Index decreased 0.1 percent compared with the previous week. The Refinance Index increased 2 percent from the previous week and was 4 percent lower than the same week one year ago. The seasonally adjusted Purchase Index increased 4 percent from one week earlier. The unadjusted Purchase Index decreased 1 percent compared with the previous week and was 20 percent lower than the same week one year ago.
“U.S. bond yields continued to move lower as incoming data signaled a softer economy and more signs of cooling inflation. Most mortgage rates in our survey decreased, with the 30-year fixed mortgage rate decreasing to 7.41 percent, the lowest rate in two months,” said Joel Kan, MBA’s Vice President and Deputy Chief Economist. “Mortgage applications increased to their highest level in six weeks, but remain at very low levels. Purchase applications were up almost four percent over the week, on a seasonally adjusted basis, as both conventional and government purchase loans saw increases. The average loan size on a purchase application was $403,600, the lowest since January 2023. This is consistent with other sources of home sales data showing a gradually increasing first-time homebuyer share.”
Added Kan, “Refinance applications increased 1.6 percent last week, but the level of refinances continues to be well below historical averages, given that most borrowers already have a rate well below current market rates.”
...
The average contract interest rate for 30-year fixed-rate mortgages with conforming loan balances ($726,200 or less) decreased to 7.41 percent from 7.61 percent, with points decreasing to 0.62 from 0.67 (including the origination fee) for 80 percent loan-to-value ratio (LTV) loans.
emphasis added
 Click on graph for larger image.
The first graph shows the MBA mortgage purchase index.
According to the MBA, purchase activity is down 20% year-over-year unadjusted.
Red is a four-week average (blue is weekly). Other than the previous five weeks, the purchase index was at the lowest level since 1995.

The second graph shows the refinance index since 1990.
With higher mortgage rates, the refinance index declined sharply in 2022 - and has mostly flat lined at a low level since then.
Tuesday, November 21, 2023
Wednesday: Unemployment Claims, Durable Goods
by Calculated Risk on 11/21/2023 08:38:00 PM
 Note: Mortgage rates are from MortgageNewsDaily.com and are for top tier scenarios.
Wednesday:
• At 7:00 AM ET, The Mortgage Bankers Association (MBA) will release the results for the mortgage purchase applications index.
• At 8:30 AM, The initial weekly unemployment claims report will be released. The consensus is for 229 thousand initial claims, down from 231 thousand last week.
• Also at 8:30 AM, Durable Goods Orders for October from the Census Bureau. The consensus is for a 3.0% decrease in durable goods orders.
• At 10:00 AM, University of Michigan's Consumer sentiment index (Final for November).
FOMC Minutes: "All participants agreed that the Committee was in a position to proceed carefully"
by Calculated Risk on 11/21/2023 02:00:00 PM
From the Fed: Minutes of the Federal Open Market Committee, October 31–November 1, 2023. Excerpt:
Participants noted that real GDP had expanded at an unexpectedly strong pace in the third quarter, boosted by a surge in consumer spending. Nevertheless, participants judged that aggregate demand and aggregate supply continued to come into better balance, as a result of the current restrictive stance of monetary policy and the continued normalization of aggregate supply conditions. Participants assessed that while labor market conditions remained tight, they had eased since earlier in the year, partly as a result of recent increases in labor supply. Participants judged that the current stance of monetary policy was restrictive and was putting downward pressure on economic activity and inflation. In addition, they noted that financial conditions had tightened significantly in recent months. Participants noted that inflation had moderated over the past year but stressed that current inflation remained unacceptably high and well above the Committee's longer-run goal of 2 percent. They also stressed that further evidence would be required for them to be confident that inflation was clearly on a path to the Committee's 2 percent objective. Participants continued to view a period of below-potential growth in real GDP and some further softening in labor market conditions as likely to be needed to reduce inflation pressures sufficiently to return inflation to 2 percent over time.
...
In discussing the policy outlook, participants continued to judge that it was critical that the stance of monetary policy be kept sufficiently restrictive to return inflation to the Committee's 2 percent objective over time. All participants agreed that the Committee was in a position to proceed carefully and that policy decisions at every meeting would continue to be based on the totality of incoming information and its implications for the economic outlook as well as the balance of risks. Participants noted that further tightening of monetary policy would be appropriate if incoming information indicated that progress toward the Committee's inflation objective was insufficient. Participants expected that the data arriving in coming months would help clarify the extent to which the disinflation process was continuing, aggregate demand was moderating in the face of tighter financial and credit conditions, and labor markets were reaching a better balance between demand and supply. Participants noted the importance of continuing to communicate clearly about the Committee's data-dependent approach and its firm commitment to bring inflation down to 2 percent.
All participants judged that it would be appropriate for policy to remain at a restrictive stance for some time until inflation is clearly moving down sustainably toward the Committee's objective. Participants also observed that the continuing process of reducing the size of the Federal Reserve's balance sheet was an important part of the overall approach to achieving their macroeconomic objectives. A few participants noted that the process of balance sheet runoff could continue for some time, even after the Committee begins to reduce the target range for the federal funds rate. Several participants commented on the recent decline in the use of the ON RRP facility, noting that the use of the facility had been responsive to market conditions.
emphasis added
NAR: Existing-Home Sales Decreased to 3.79 million SAAR in October; New Cycle Low, Months-of-Supply Close to 2019 Levels
by Calculated Risk on 11/21/2023 10:54:00 AM
Today, in the CalculatedRisk Real Estate Newsletter: NAR: Existing-Home Sales Decreased to 3.79 million SAAR in October; New Cycle Low
Excerpt:
Sales Year-over-Year and Not Seasonally Adjusted (NSA)There is much more in the article. You can subscribe at https://calculatedrisk.substack.com/ Please subscribe!
The fourth graph shows existing home sales by month for 2022 and 2023.
Sales declined 14.6% year-over-year compared to October 2022. This was the twenty-sixth consecutive month with sales down year-over-year. This was a new cycle low, below the 3.95 million SAAR in September 2023.

NAR: Existing-Home Sales Decreased to 3.79 million SAAR in October
by Calculated Risk on 11/21/2023 10:00:00 AM
From the NAR: Existing-Home Sales Receded 4.1% in October
Existing-home sales dropped in October, according to the National Association of REALTORS®. Among the four major U.S. regions, sales slid in the Northeast, South and West but were unchanged in the Midwest. All four regions experienced year-over-year sales declines.
Total existing-home sales – completed transactions that include single-family homes, townhomes, condominiums and co-ops – fell 4.1% from September to a seasonally adjusted annual rate of 3.79 million in October. Year-over-year, sales tumbled 14.6% (down from 4.44 million in October 2022).
...
Total housing inventory registered at the end of October was 1.15 million units, up 1.8% from September but down 5.7% from one year ago (1.22 million). Unsold inventory sits at a 3.6-month supply at the current sales pace, up from 3.4 months in September and 3.3 months in October 2022.
emphasis added
 Click on graph for larger image.
This graph shows existing home sales, on a Seasonally Adjusted Annual Rate (SAAR) basis since 1994.
Sales in October (3.79 million SAAR) were down 4.1% from the previous month and were 14.6% below the October 2022 sales rate.
The second graph shows nationwide inventory for existing homes.
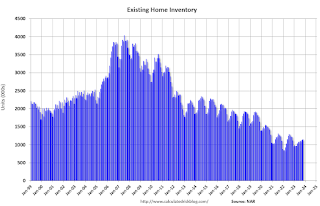 According to the NAR, inventory increased to 1.15 million in October from 1.13 million the previous month.
 According to the NAR, inventory increased to 1.15 million in October from 1.13 million the previous month.
Headline inventory is not seasonally adjusted, and inventory usually decreases to the seasonal lows in December and January, and peaks in mid-to-late summer.
The last graph shows the year-over-year (YoY) change in reported existing home inventory and months-of-supply. Since inventory is not seasonally adjusted, it really helps to look at the YoY change. Note: Months-of-supply is based on the seasonally adjusted sales and not seasonally adjusted inventory.
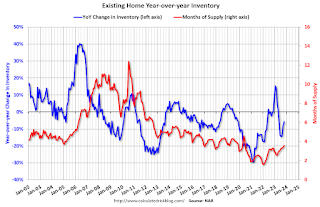 Inventory was down 5.7% year-over-year (blue) in October compared to October 2022.
Months of supply (red) increased to 3.6 months in October from 3.4 months the previous month.
This was below the consensus forecast. I'll have more later.
The last graph shows the year-over-year (YoY) change in reported existing home inventory and months-of-supply. Since inventory is not seasonally adjusted, it really helps to look at the YoY change. Note: Months-of-supply is based on the seasonally adjusted sales and not seasonally adjusted inventory.
 Inventory was down 5.7% year-over-year (blue) in October compared to October 2022.
 Months of supply (red) increased to 3.6 months in October from 3.4 months the previous month.
This was below the consensus forecast. I'll have more later.


