 RSS Feed
 by Calculated Risk on 11/27/2023 10:44:00 AM
Monday, November 27, 2023
New Home Sales decrease to 679,000 Annual Rate in October; Median New Home Price is Down 18% from the Peak
Today, in the Calculated Risk Real Estate Newsletter: New Home Sales decrease to 679,000 Annual Rate in October
Brief excerpt:
The Census Bureau reports New Home Sales in October were at a seasonally adjusted annual rate (SAAR) of 679 thousand. The previous three months were revised down.You can subscribe at https://calculatedrisk.substack.com/.
...
The next graph shows new home sales for 2022 and 2023 by month (Seasonally Adjusted Annual Rate). Sales in October 2023 were up 17.7% from October 2022. Year-to-date sales are up 4.6% compared to the same period in 2022.
As expected, new home sales were up solidly year-over-year in October, and there will be more sales in 2023 than in 2022.

New Home Sales decrease to 679,000 Annual Rate in October
by Calculated Risk on 11/27/2023 10:00:00 AM
The Census Bureau reports New Home Sales in October were at a seasonally adjusted annual rate (SAAR) of 679 thousand.
The previous three months were revised down.
Sales of new single‐family houses in October 2023 were at a seasonally adjusted annual rate of 679,000, according to estimates released jointly today by the U.S. Census Bureau and the Department of Housing and Urban Development. This is 5.6 percent below the revised September rate of 719,000, but is 17.7 percent above the October 2022 estimate of 577,000.
emphasis added
 Click on graph for larger image.
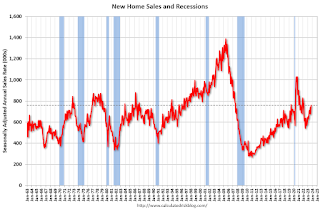
The first graph shows New Home Sales vs. recessions since 1963. The dashed line is the current sales rate.
New home sales are close to pre-pandemic levels.
The second graph shows New Home Months of Supply.
 The months of supply increased in October to 7.8 months from 7.2 months in September.
 The all-time record high was 12.2 months of supply in January 2009. The all-time record low was 3.3 months in August 2020.
This is above the top of the normal range (about 4 to 6 months of supply is normal).
"The seasonally‐adjusted estimate of new houses for sale at the end of October was 439,000. This represents a supply of 7.8 months at the current sales rate."Sales were well below expectations of 730 thousand SAAR, and sales for the three previous months were revised down. I'll have more later today.
Housing November 27th Weekly Update: Inventory Down Week-over-week, Up Slightly Year-over-year
by Calculated Risk on 11/27/2023 08:11:00 AM
Altos reports that active single-family inventory was down 0.7% week-over-week and is now up 0.2% year-over-year. Inventory will decrease seasonally for next several weeks (for the Holidays).
 Click on graph for larger image.
This inventory graph is courtesy of Altos Research.
As of November 24th, inventory was at 566 thousand (7-day average), compared to 570 thousand the prior week.
Year-to-date, inventory is up 15.3%.

The red line is for 2023. The black line is for 2019. Note that inventory is up from the record low for the same week in 2021, but below last year and still well below normal levels.
Inventory was up 0.2% compared to the same week in 2022 (last week it was up 0.1%), and down 35.1% compared to the same week in 2019 (last week down 35.7%).
Inventory is now solidly above the same week in 2020 levels (dark blue line).
Mike Simonsen discusses this data regularly on Youtube.
Sunday, November 26, 2023
Monday: New Home Sales
by Calculated Risk on 11/26/2023 06:49:00 PM
Weekend:
• Schedule for Week of November 26, 2023
Monday:
• At 10:00 AM ET, New Home Sales for October from the Census Bureau. The consensus is for 730 thousand SAAR, down from 759 thousand in September.
• At 10:30 AM, Dallas Fed Survey of Manufacturing Activity for November.
From CNBC: Pre-Market Data and Bloomberg futures S&P 500 futures are down 8 and DOW futures are down 32 (fair value).
Oil prices were down over the last week with WTI futures at $75.54 per barrel and Brent at $80.58 per barrel. A year ago, WTI was at $76, and Brent was at $83 - so WTI oil prices were down slightly year-over-year.
Here is a graph from Gasbuddy.com for nationwide gasoline prices. Nationally prices are at $3.21 per gallon. A year ago, prices were at $3.54 per gallon, so gasoline prices are down $0.33 year-over-year.
2024 Conforming Loan Limits Will be Released on Tuesday
by Calculated Risk on 11/26/2023 09:31:00 AM
Although Case-Shiller usually receives more attention, the FHFA index will be a focus on Tuesday - since the quarterly FHFA Expanded-Data Indexes (Estimated using Enterprise, FHA, and Real Property County Recorder Data Licensed from DataQuick for sales below the annual loan limit ceiling) is used to set the Fannie and Freddie conforming loan limits (CLL), and the FHA insured limit.
For 2023, the CLL for one-unit properties was set at $726,200, and for high cost areas the ceiling loan limit for one-unit properties was $1,089,300.
Based on the monthly FHFA index, the CLL will probably increase around 6% for 2024 to around $770,000, and to $1,155,000 for high cost areas.
Saturday, November 25, 2023
Real Estate Newsletter Articles this Week: Existing-Home Sales Decreased to 3.79 million SAAR in October; New Cycle Low
by Calculated Risk on 11/25/2023 02:11:00 PM
At the Calculated Risk Real Estate Newsletter this week:
• NAR: Existing-Home Sales Decreased to 3.79 million SAAR in October; New Cycle Low
• Lawler on Existing Home Sales, Population Projections and Household Slowdown
• 4th Look at Local Housing Markets in October
This is usually published 4 to 6 times a week and provides more in-depth analysis of the housing market.
You can subscribe at https://calculatedrisk.substack.com/
Schedule for Week of November 26, 2023
by Calculated Risk on 11/25/2023 08:11:00 AM
The key reports this week include the 2nd estimate of Q3 GDP and October New Home Sales.
Other key indicators include the September Case-Shiller and FHFA house price indexes, October Personal Income & Outlays (and PCE), the November ISM manufacturing index, and November vehicle sales.
----- Monday, November 27th -----
 10:00 AM: New Home Sales for October from the Census Bureau.
This graph shows New Home Sales since 1963. The dashed line is the sales rate for last month.
The consensus is for 730 thousand SAAR, down from 759 thousand in September.
10:30 AM: Dallas Fed Survey of Manufacturing Activity for November.
----- Tuesday, November 28th -----
 9:00 AM ET: S&P/Case-Shiller House Price Index for September.
This graph shows graph shows the Year over year change in the seasonally adjusted National Index, Composite 10 and Composite 20 indexes through the most recent report (the Composite 20 was started in January 2000).
The National index was up 2.6% YoY in August and is expected to increase further in September.
9:00 AM: FHFA House Price Index for September. This was originally a GSE only repeat sales, however there is also an expanded index. The 2023 Conforming loan limits will also be announced.
10:00 AM: Richmond Fed Survey of Manufacturing Activity for November. This is the last of the regional Fed manufacturing surveys for November.
----- Wednesday, November 29th -----
7:00 AM ET: The Mortgage Bankers Association (MBA) will release the results for the mortgage purchase applications index.
8:30 AM: Gross Domestic Product (Second Estimate) and Corporate Profits (Preliminary), 3rd Quarter 2023. The consensus is that real GDP increased 5.0% annualized in Q3, up from the advance estimate of 4.9% in Q3.
2:00 PM: the Federal Reserve Beige Book, an informal review by the Federal Reserve Banks of current economic conditions in their Districts.
----- Thursday, November 30th -----
8:30 AM: The initial weekly unemployment claims report will be released. Initial claims were at 209 thousand last week.
8:30 AM: Personal Income and Outlays, October 2023. The consensus is for a 0.2% increase in personal income, and for a 0.2% increase in personal spending. And for the Core PCE price index to increase 0.2%. PCE prices are expected to be up 3.1% YoY, and core PCE prices up 3.5% YoY.
9:45 AM: Chicago Purchasing Managers Index for November.
10:00 AM: Pending Home Sales Index for October. The consensus is for a 0.6% decrease in the index.
----- Friday, December 1st -----
10:00 AM: ISM Manufacturing Index for November. The consensus is for 47.7%, up from 46.7%.
10:00 AM: Construction Spending for October. The consensus is for 0.4% increase in spending.
11:00 AM: Discussion, Fed Chair Jerome Powell, Conversation with Spelman College President Helene Gayle, At a Fireside Chat at Spelman College, Atlanta, Ga.
 All day: Light vehicle sales for November.
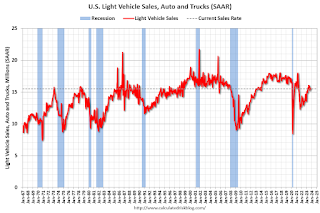
The consensus is for 15.5 million SAAR in November, unchanged from the BEA estimate of 15.5 million SAAR in October (Seasonally Adjusted Annual Rate).
This graph shows light vehicle sales since the BEA started keeping data in 1967. The dashed line is the current sales rate.
 10:00 AM: New Home Sales for October from the Census Bureau.
 This graph shows New Home Sales since 1963. The dashed line is the sales rate for last month.
The consensus is for 730 thousand SAAR, down from 759 thousand in September.
10:30 AM: Dallas Fed Survey of Manufacturing Activity for November.
 9:00 AM ET: S&P/Case-Shiller House Price Index for September.
This graph shows graph shows the Year over year change in the seasonally adjusted National Index, Composite 10 and Composite 20 indexes through the most recent report (the Composite 20 was started in January 2000).
The National index was up 2.6% YoY in August and is expected to increase further in September.
9:00 AM: FHFA House Price Index for September. This was originally a GSE only repeat sales, however there is also an expanded index. The 2023 Conforming loan limits will also be announced.
10:00 AM: Richmond Fed Survey of Manufacturing Activity for November. This is the last of the regional Fed manufacturing surveys for November.
7:00 AM ET: The Mortgage Bankers Association (MBA) will release the results for the mortgage purchase applications index.
8:30 AM: Gross Domestic Product (Second Estimate) and Corporate Profits (Preliminary), 3rd Quarter 2023. The consensus is that real GDP increased 5.0% annualized in Q3, up from the advance estimate of 4.9% in Q3.
2:00 PM: the Federal Reserve Beige Book, an informal review by the Federal Reserve Banks of current economic conditions in their Districts.
8:30 AM: The initial weekly unemployment claims report will be released. Initial claims were at 209 thousand last week.
8:30 AM: Personal Income and Outlays, October 2023. The consensus is for a 0.2% increase in personal income, and for a 0.2% increase in personal spending. And for the Core PCE price index to increase 0.2%. PCE prices are expected to be up 3.1% YoY, and core PCE prices up 3.5% YoY.
9:45 AM: Chicago Purchasing Managers Index for November.
10:00 AM: Pending Home Sales Index for October. The consensus is for a 0.6% decrease in the index.
10:00 AM: ISM Manufacturing Index for November. The consensus is for 47.7%, up from 46.7%.
10:00 AM: Construction Spending for October. The consensus is for 0.4% increase in spending.
11:00 AM: Discussion, Fed Chair Jerome Powell, Conversation with Spelman College President Helene Gayle, At a Fireside Chat at Spelman College, Atlanta, Ga.
 All day: Light vehicle sales for November.
The consensus is for 15.5 million SAAR in November, unchanged from the BEA estimate of 15.5 million SAAR in October (Seasonally Adjusted Annual Rate).
This graph shows light vehicle sales since the BEA started keeping data in 1967. The dashed line is the current sales rate.
Friday, November 24, 2023
Hotels: Occupancy Rate Decreased 0.6% Year-over-year
by Calculated Risk on 11/24/2023 03:25:00 PM
U.S. hotel performance showed mixed year-over-year comparisons, according to CoStar’s latest data through 18 November. ...The following graph shows the seasonal pattern for the hotel occupancy rate using the four-week average.
12-18 November 2023 (percentage change from comparable week in 2022):
• Occupancy: 62.4% (-0.6%)
• Average daily rate (ADR): US$156.47 (+7.0%)
• Revenue per available room (RevPAR): US$97.61 (+6.3%)
emphasis added
 Click on graph for larger image.
The red line is for 2023, black is 2020, blue is the median, and dashed light blue is for 2022. Dashed purple is for 2018, the record year for hotel occupancy.
The 4-week average of the occupancy rate is tracking close to last year, and above the median rate for the period 2000 through 2022 (Blue).
Note: Y-axis doesn't start at zero to better show the seasonal change.
The 4-week average of the occupancy rate will decline seasonally for the next couple of months.
Realtor.com Reports Active Inventory UP 1.5% YoY; New Listings up 5.0% YoY
by Calculated Risk on 11/24/2023 12:31:00 PM
Realtor.com has monthly and weekly data on the existing home market. Here is their weekly report: Weekly Housing Trends View — Data Week Ending Nov 18, 2023
• Active inventory increased slightly, with for-sale homes 1.5% above year ago levels. Active listings exceeded last year’s levels again this week, falling in line with last week’s trend.
• New listings–a measure of sellers putting homes up for sale–were up this week, by 5.0% from one year ago. New listings registered lower than prior year levels from mid-2022 through roughly 4 weeks ago, as the mortgage rate lock-in effect freezes homeowners with low-rate existing mortgages in place. Over the last three weeks, however, the trend has reversed and new listings during this week outpaced the same week in the previous year by 5.0%.
 Here is a graph of the year-over-year change in inventory according to realtor.com.
 Inventory was up year-over-year for the 2nd consecutive week following 20 consecutive weeks with a YoY decrease in inventory.
Inventory is still historically very low.
New listings really collapsed a year ago, so the YoY comparison for new listings is easier now - and although new listings also remain historically very low, new listings are now up YoY.
Q4 GDP Tracking: Around 2%
by Calculated Risk on 11/24/2023 10:40:00 AM
From BofA:
Overall, this reduced our 4Q US GDP tracking estimate down a tenth to 1.4% q/q saar from our official forecast of 1.5% q/q saar. Also, 3Q GDP remains unchanged from our last weekly publication at 5.2% q/q saar. [Nov 22nd estimate]From Goldman:
emphasis added
The inventory details of the durable goods report were firmer than our previous assumptions, and we boosted our Q4 GDP tracking estimate by one tenth to +2.0% (qoq ar). Our Q4 domestic final sales estimate also stands at +2.0%. [Nov 22nd estimate]And from the Altanta Fed: GDPNow
The GDPNow model estimate for real GDP growth (seasonally adjusted annual rate) in the fourth quarter of 2023 is 2.1 percent on November 22, up from 2.0 percent on November 17. After recent releases from the US Census Bureau and the National Association of Realtors, the nowcast of fourth-quarter real gross private domestic investment growth increased from -1.8 percent to -1.1 percent. [Nov 22nd estimate]


